Facilities
103
Average number of child care facilities monitored from FY2020 through FY2024.
Environmental Health / Child Care
Southeastern Idaho Public Health's Child Care Program helps ensure safe, healthy, and nurturing environments for children by upholding state and national standards. Through inspections, education, and collaboration with providers, the program promotes high-quality care and compliance with health and safety standards.
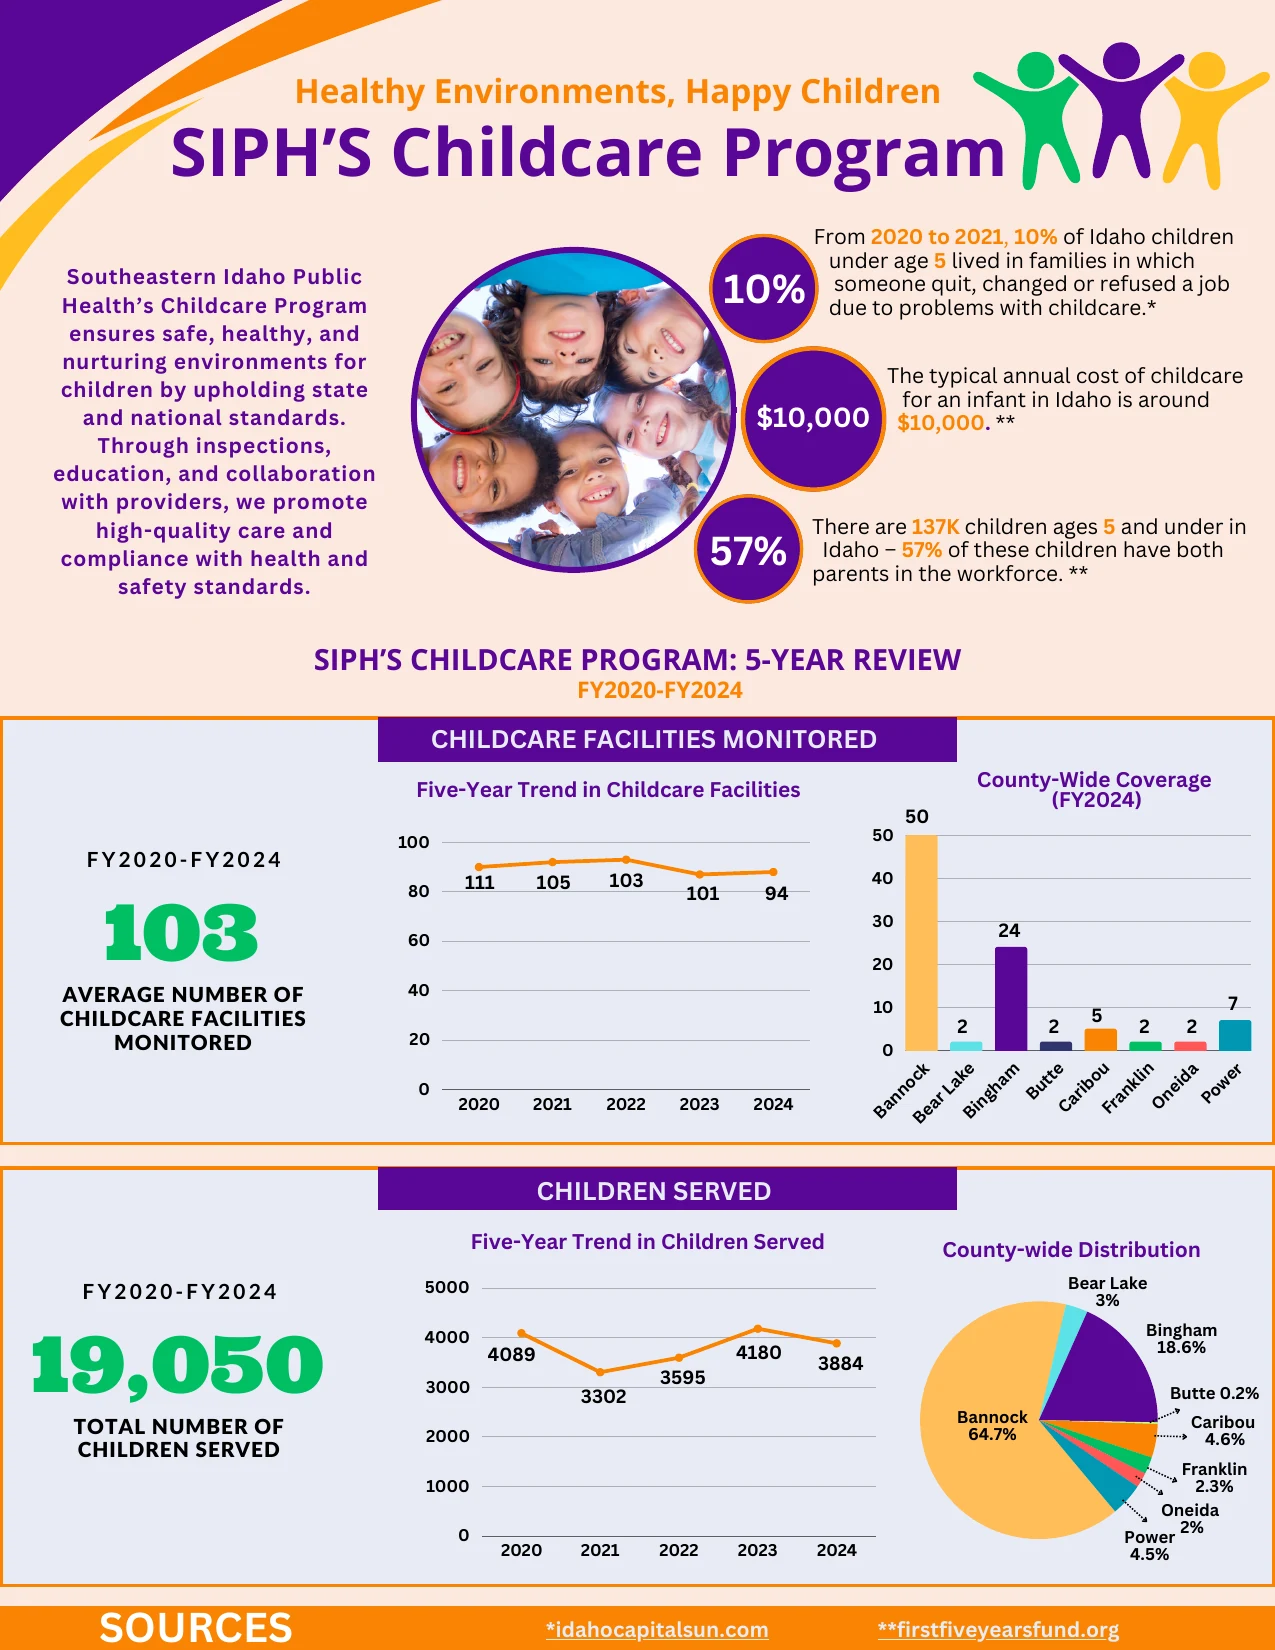
A quick snapshot of the FY2020-FY2024 report, with detailed data available below.
Facilities
Average number of child care facilities monitored from FY2020 through FY2024.
Children Served
Total number of children served during the five-year period.
Inspections
Total inspections reported from FY2020 through FY2024.
Compliance
Facilities were compliant after intervention during the five-year period.
Each section pairs a report visual with detailed, accessible data that can be expanded as needed.
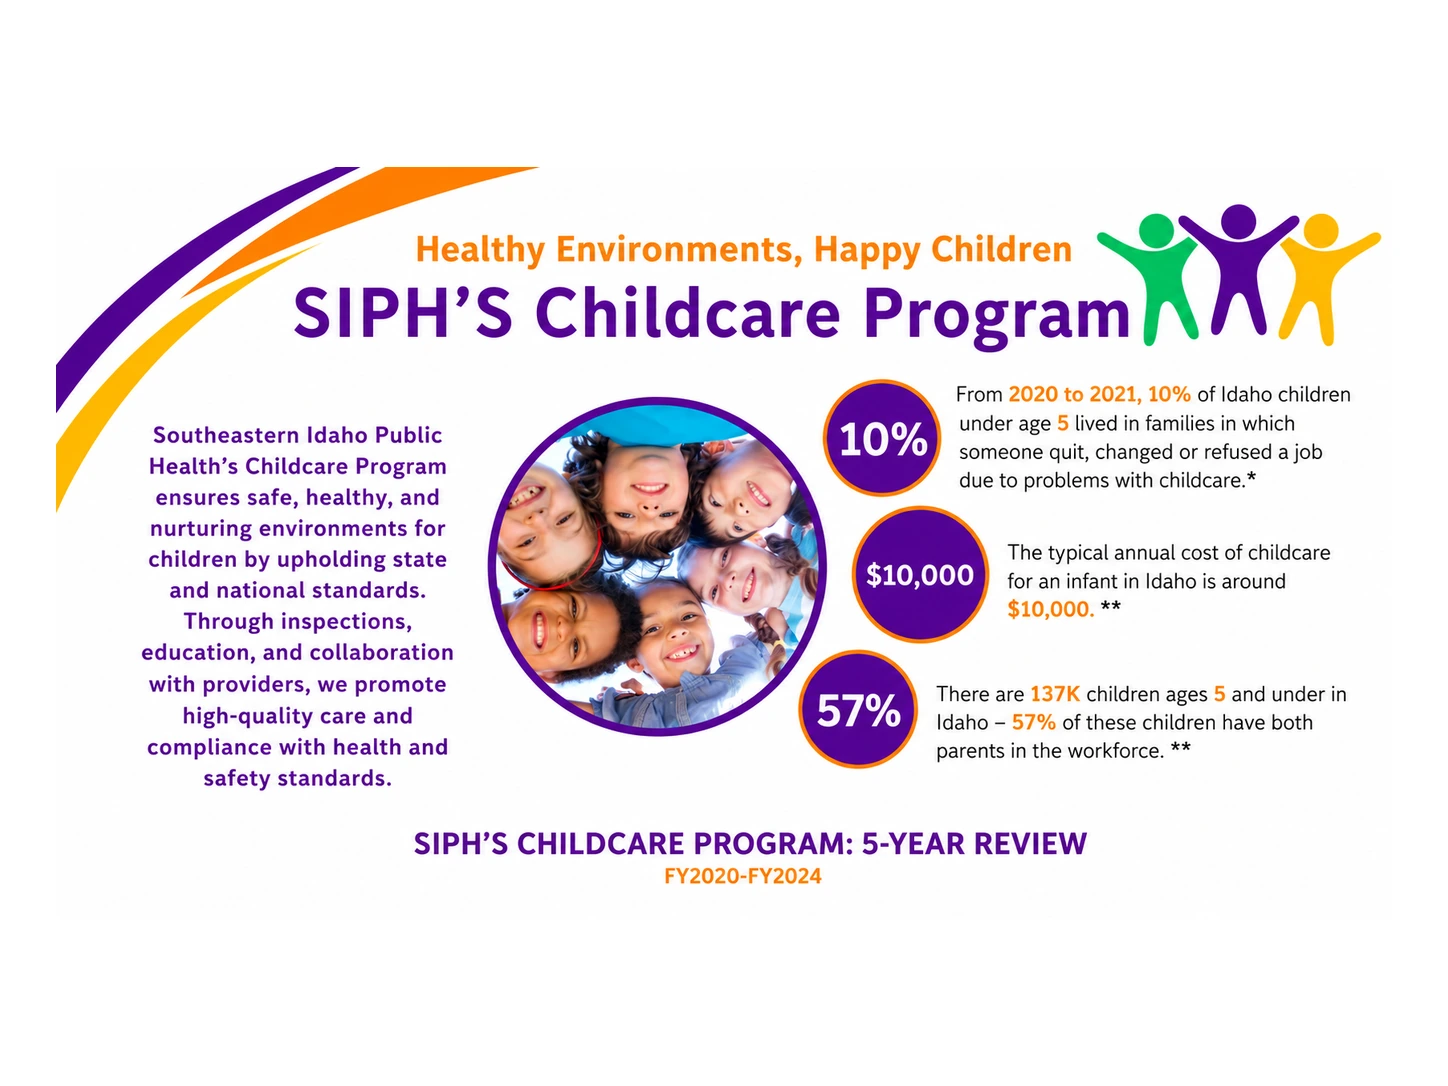
Reliable, affordable child care supports healthy children, families, and Idaho's workforce. The report highlights the cost of infant care and the employment impact of child care challenges.
| Measure | Reported Value |
|---|---|
| Idaho children under age 5 whose family changed, quit, or refused a job because of child care problems, 2020-2021 | 10% |
| Typical annual cost of infant child care in Idaho | Approximately $10,000 |
| Children ages 5 and under in Idaho | 137,000 |
| Children ages 5 and under with both parents in the workforce | 57% |
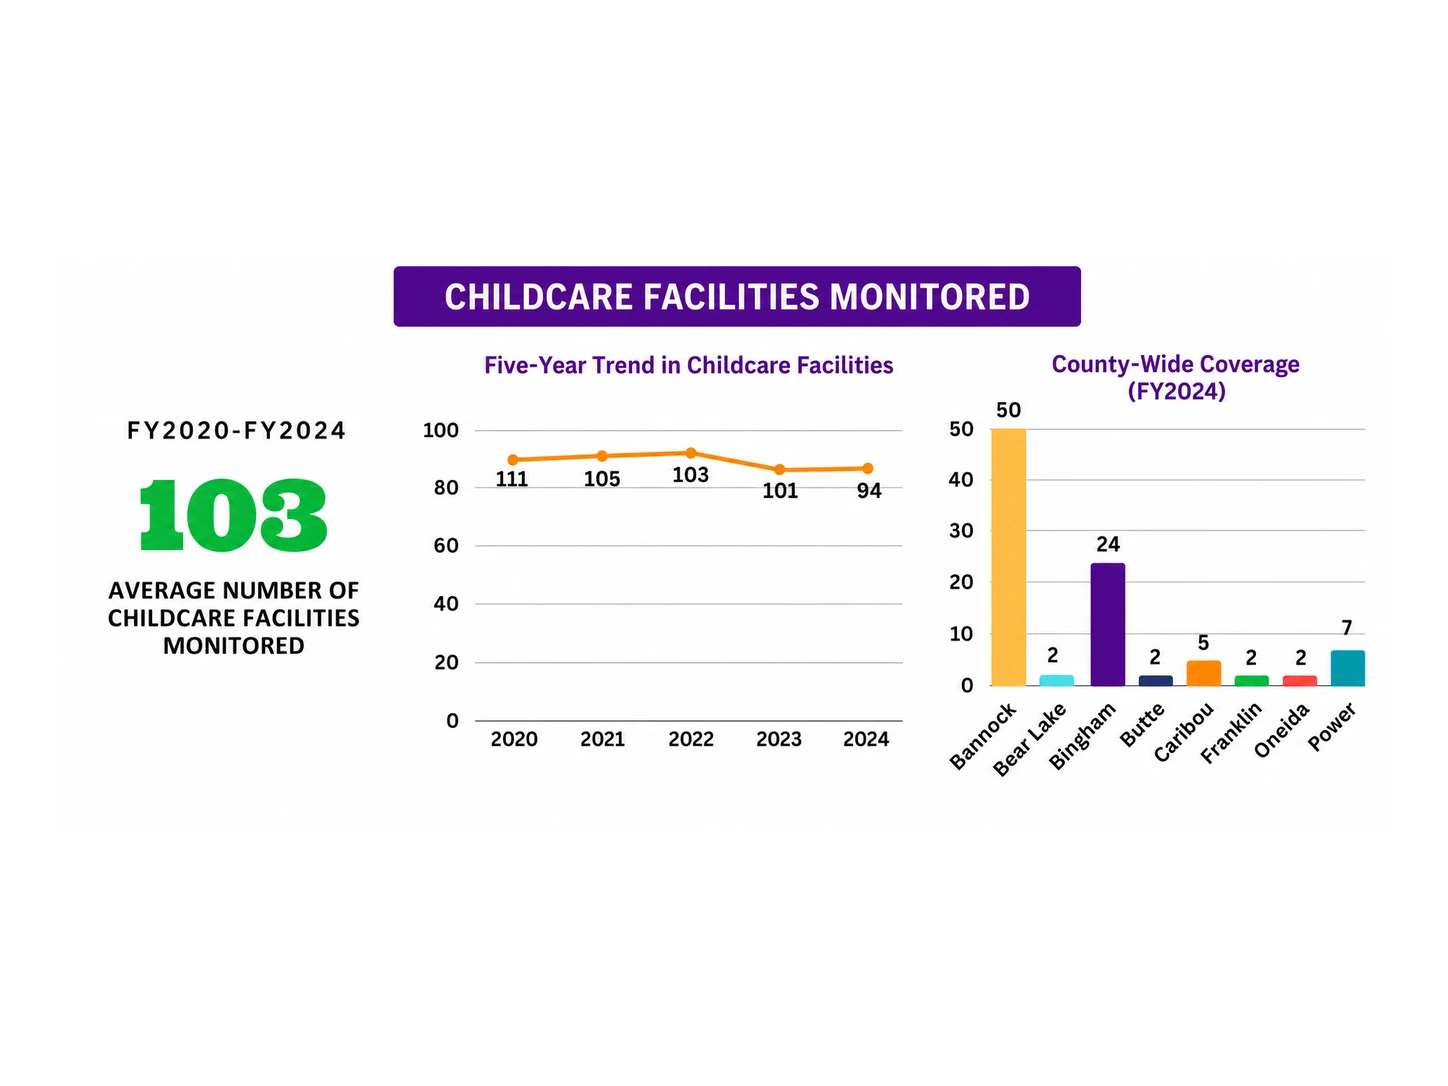
SIPH monitored an average of 103 child care facilities from FY2020 through FY2024. In FY2024, 94 facilities were monitored across the eight-county health district.
| Fiscal Year | Facilities Monitored |
|---|---|
| 2020 | 111 |
| 2021 | 105 |
| 2022 | 103 |
| 2023 | 101 |
| 2024 | 94 |
| County | Facilities |
|---|---|
| Bannock | 50 |
| Bear Lake | 2 |
| Bingham | 24 |
| Butte | 2 |
| Caribou | 5 |
| Franklin | 2 |
| Oneida | 2 |
| Power | 7 |
| Total | 94 |
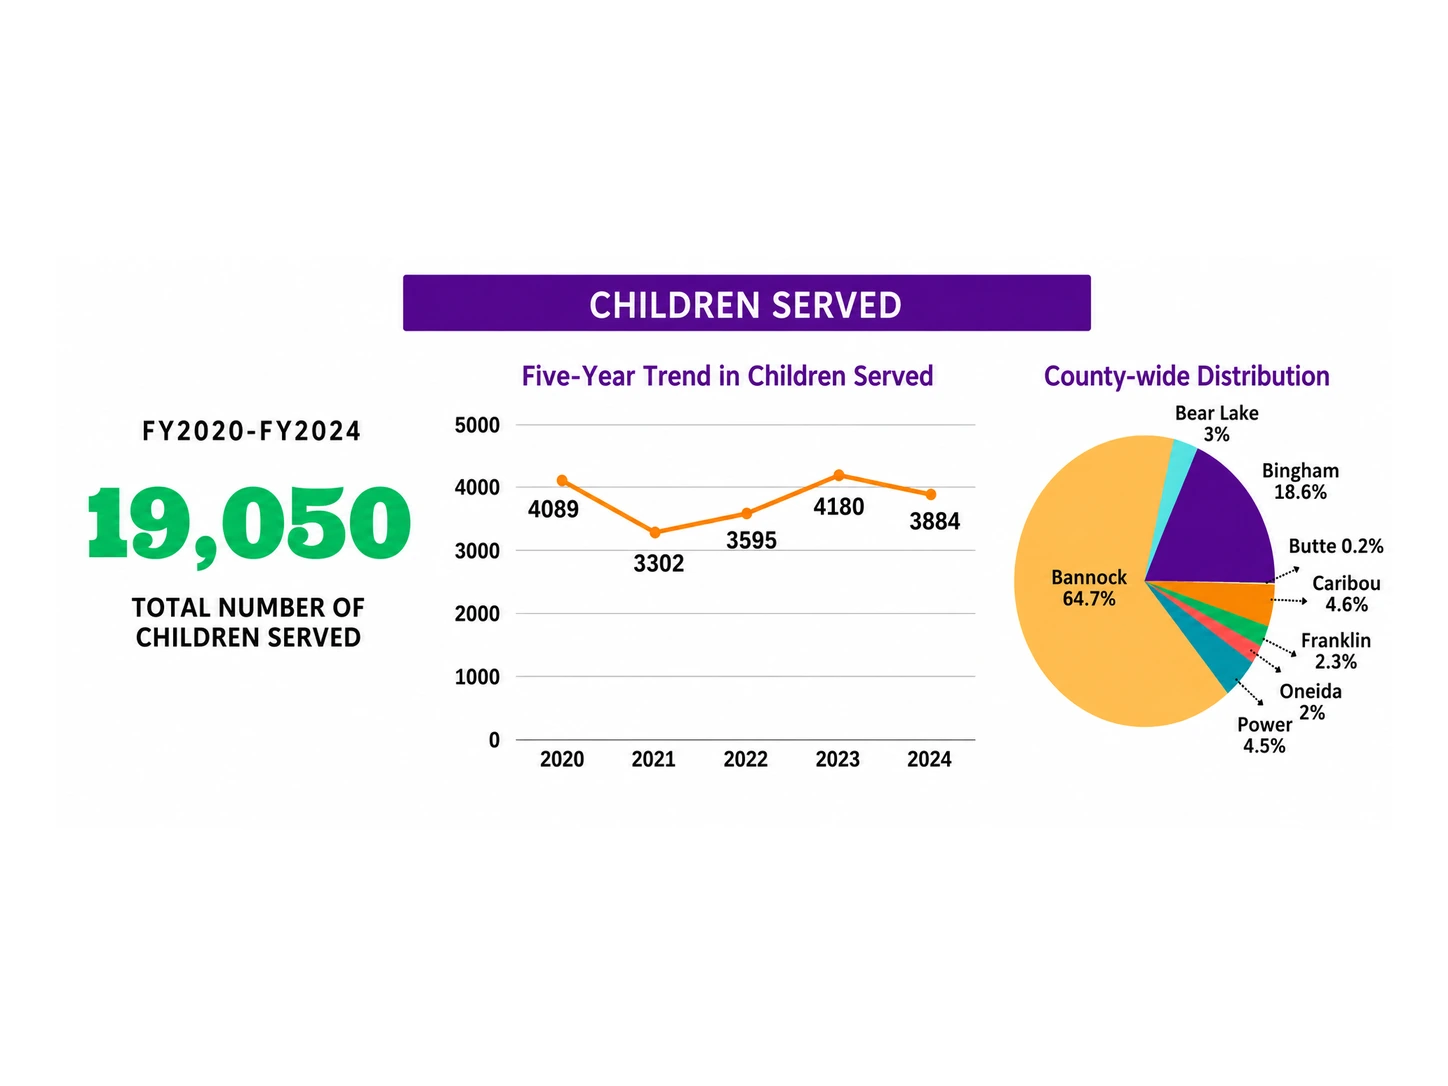
Monitored child care facilities served 19,050 children from FY2020 through FY2024. The report also shows the FY2024 county-wide distribution.
| Fiscal Year | Children Served |
|---|---|
| 2020 | 4,089 |
| 2021 | 3,302 |
| 2022 | 3,595 |
| 2023 | 4,180 |
| 2024 | 3,884 |
| Total | 19,050 |
| County | Share |
|---|---|
| Bannock | 64.7% |
| Bingham | 18.6% |
| Power | 4.5% |
| Caribou | 4.6% |
| Bear Lake | 3% |
| Franklin | 2.3% |
| Oneida | 2% |
| Butte | 0.2% |
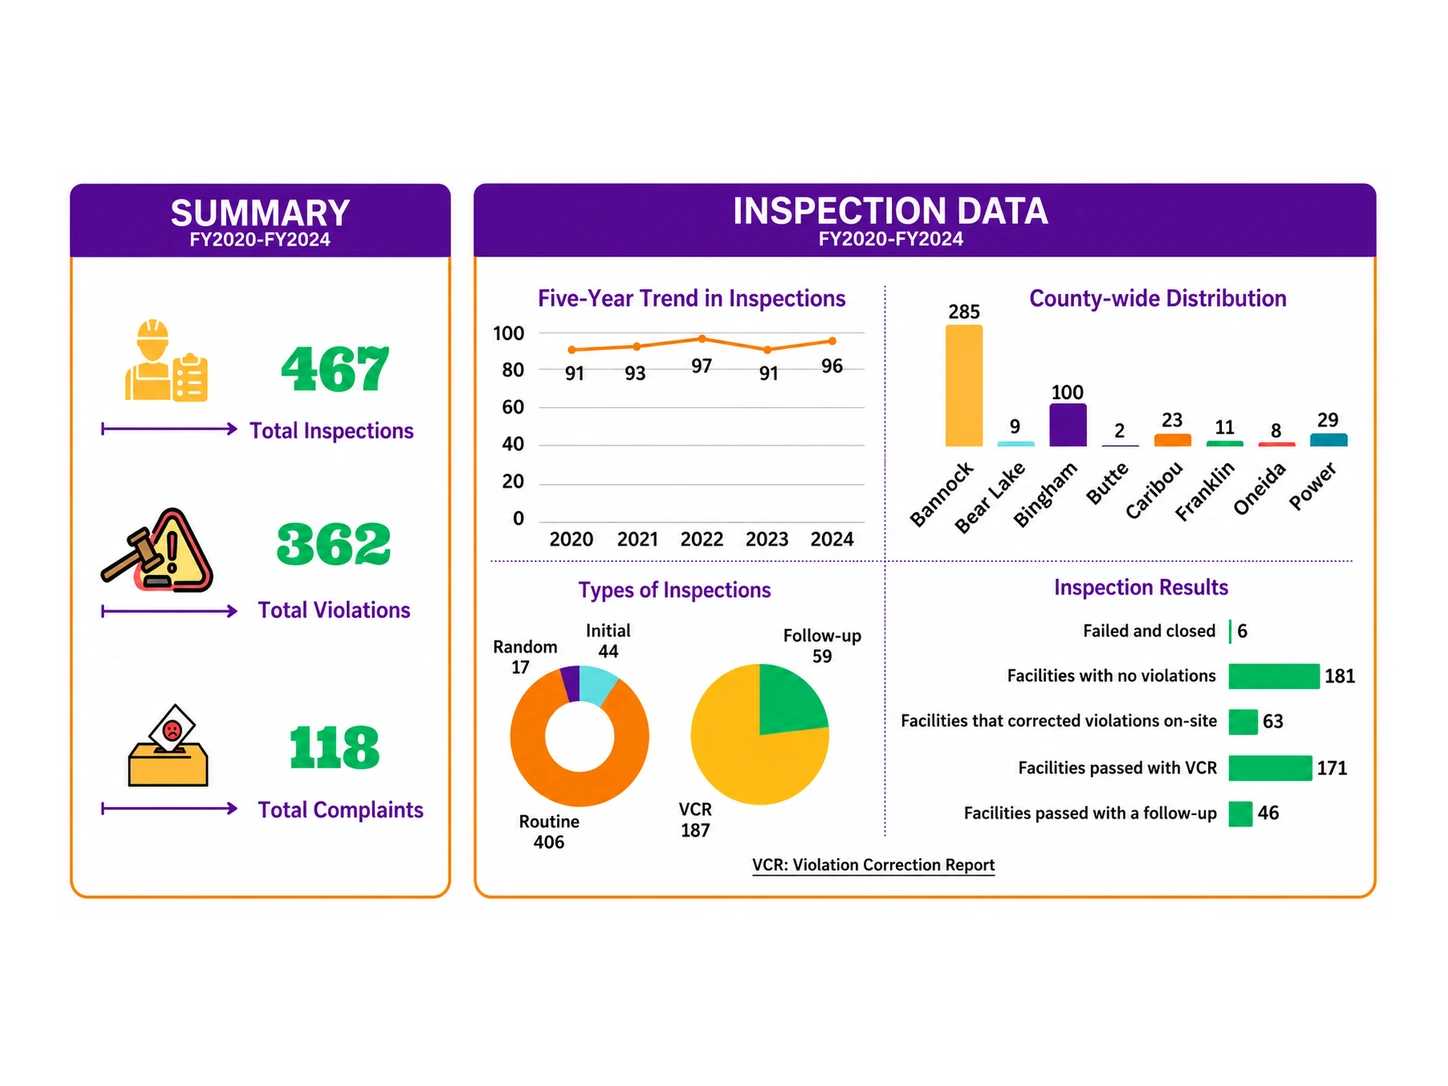
The five-year report records 467 inspections. Routine inspections were the most common, and the report tracks how facilities resolved findings.
| County | Inspections |
|---|---|
| Bannock | 285 |
| Bear Lake | 9 |
| Bingham | 100 |
| Butte | 2 |
| Caribou | 23 |
| Franklin | 11 |
| Oneida | 8 |
| Power | 29 |
| Total | 467 |
| Inspection Type | Count |
|---|---|
| Routine | 406 |
| Initial | 44 |
| Random | 17 |
| Inspection Result | Count |
|---|---|
| Failed and closed | 6 |
| Facilities with no violations | 181 |
| Facilities that corrected violations on-site | 63 |
| Facilities passed with a Violation Correction Report (VCR) | 171 |
| Facilities passed with a follow-up | 46 |
Source note: the annual inspection labels shown in the original trend graphic appear to total 468, while the report summary and county totals both report 467 inspections.
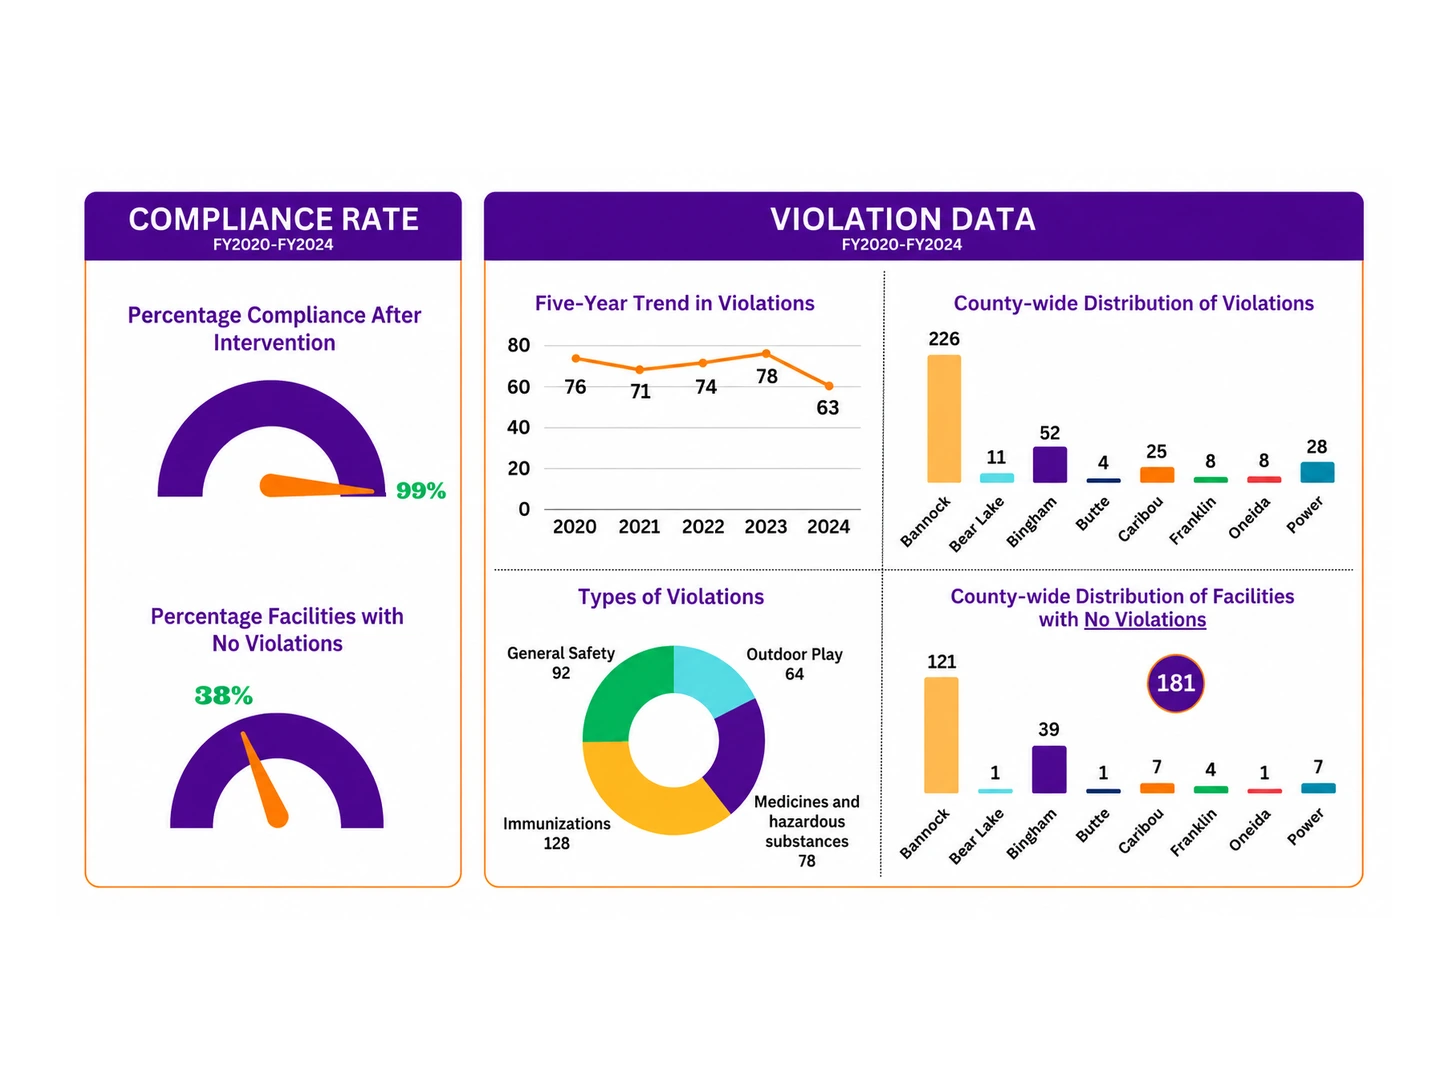
The report shows a 99% compliance rate after intervention. It also records 362 violations, with immunizations and general safety as the two largest categories.
| Measure | Rate |
|---|---|
| Compliance after intervention | 99% |
| Facilities with no violations | 38% |
| Fiscal Year | Violations |
|---|---|
| 2020 | 76 |
| 2021 | 71 |
| 2022 | 74 |
| 2023 | 78 |
| 2024 | 63 |
| Total | 362 |
| County | Violations |
|---|---|
| Bannock | 226 |
| Bear Lake | 11 |
| Bingham | 52 |
| Butte | 4 |
| Caribou | 25 |
| Franklin | 8 |
| Oneida | 8 |
| Power | 28 |
| Violation Type | Count |
|---|---|
| Immunizations | 128 |
| General Safety | 92 |
| Medicines and hazardous substances | 78 |
| Outdoor Play | 64 |
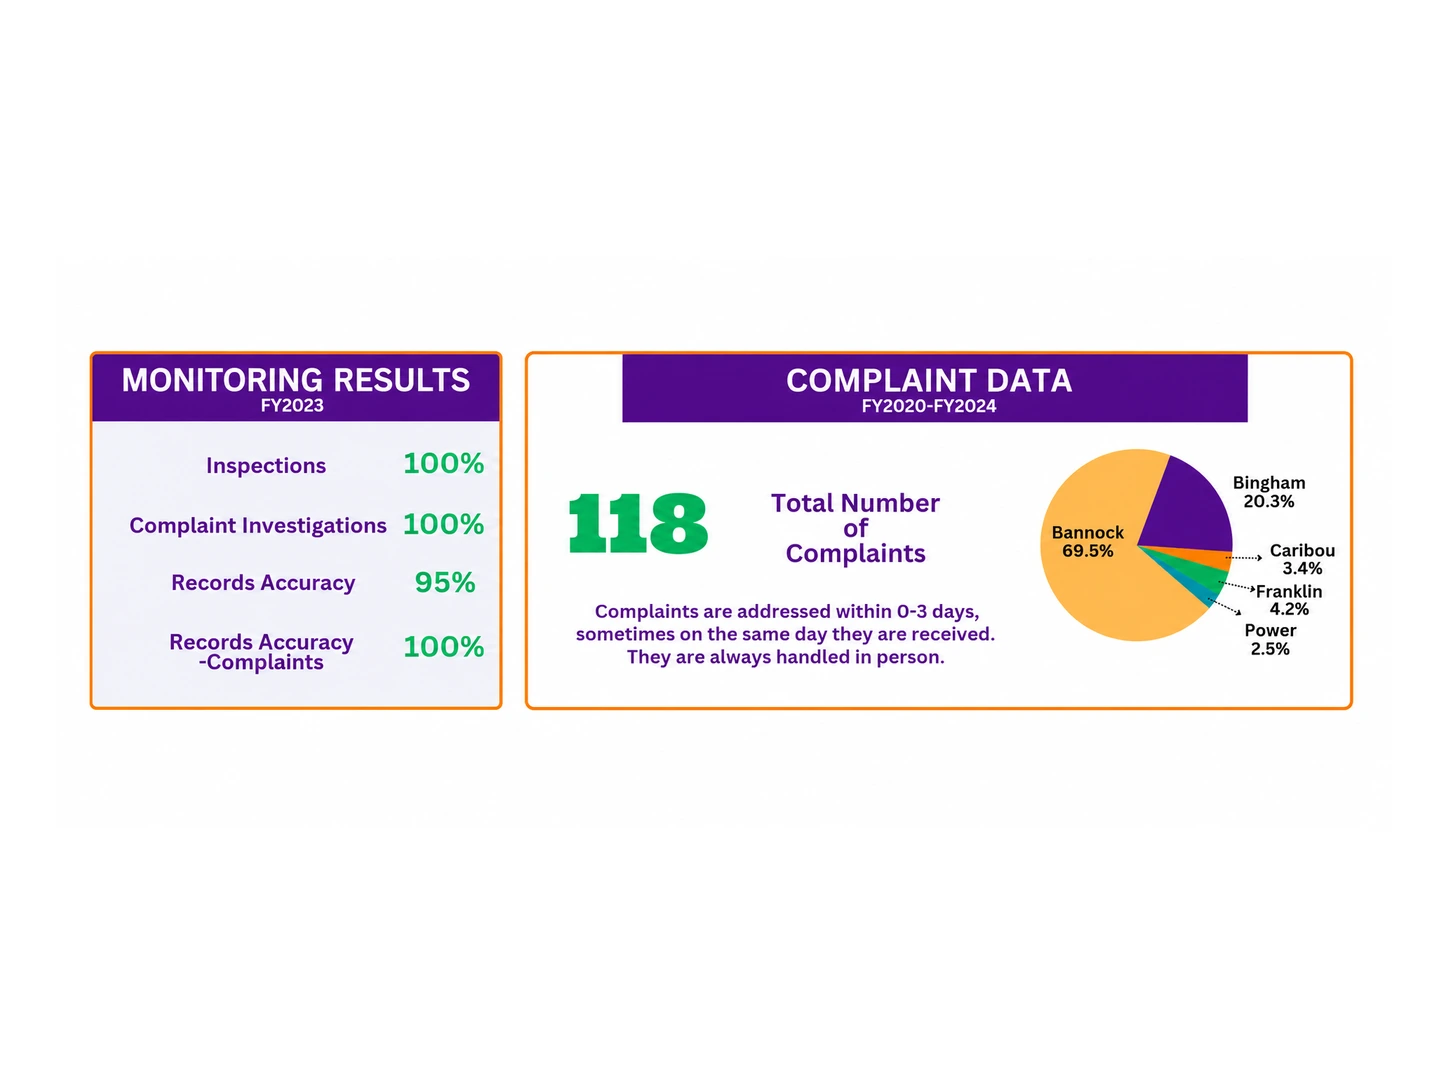
The report documents monitoring performance and 118 complaints. Complaints were addressed within zero to three days, sometimes on the day received, and were handled in person.
| Monitoring Measure | Result |
|---|---|
| Inspections | 100% |
| Complaint Investigations | 100% |
| Records Accuracy | 95% |
| Records Accuracy - Complaints | 100% |
| County | Share of Complaints |
|---|---|
| Bannock | 69.5% |
| Bingham | 20.3% |
| Franklin | 4.2% |
| Caribou | 3.4% |
| Power | 2.5% |
| Total complaints | 118 |
Select an image to open a larger version, or view the original PDF.
Program overview, child care impact, facilities monitored, and children served.
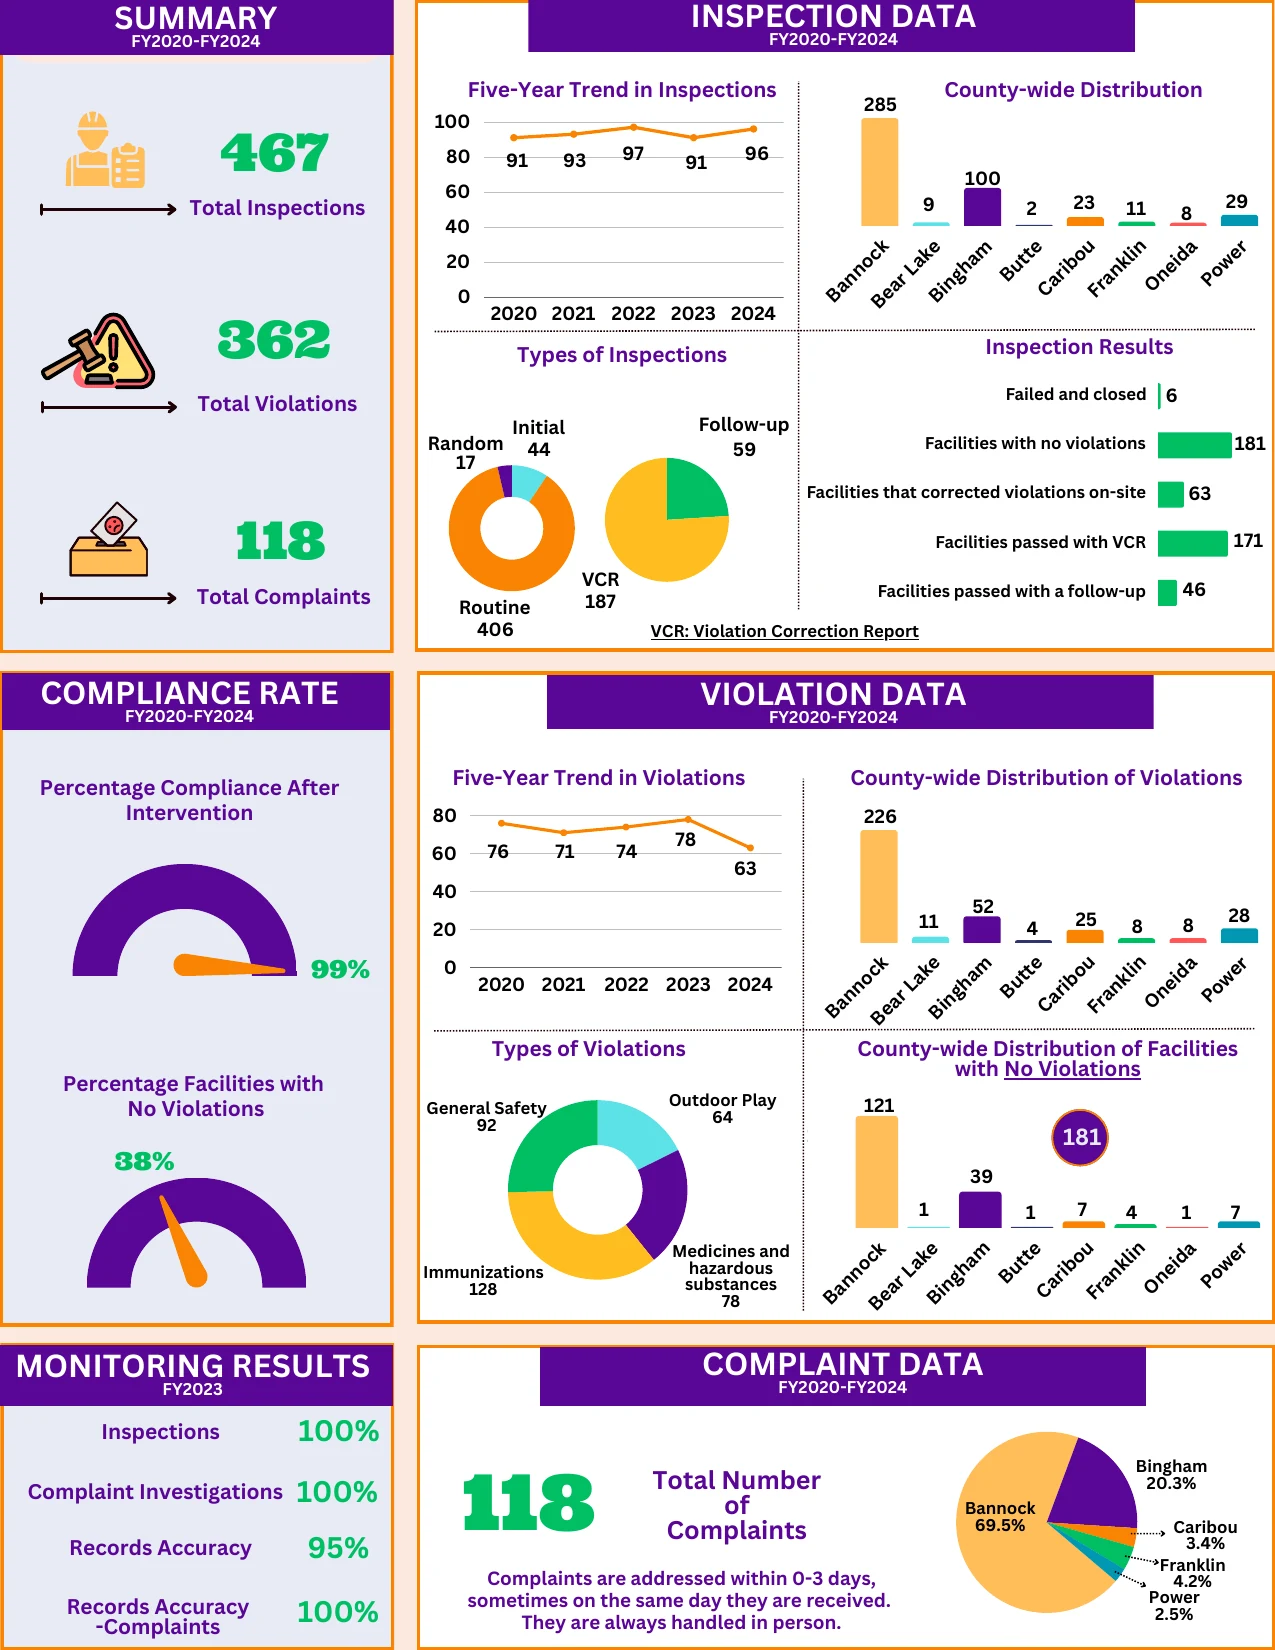
Inspection and violation data, compliance rates, monitoring results, and complaint data.