Clients Served
4,054
Total clients served during the five-year review.
Clinical Services / Family Planning
Southeastern Idaho Public Health's Family Planning Program helps individuals make informed decisions about reproductive health by providing education, preventive services, birth control access, testing, referrals, and support.
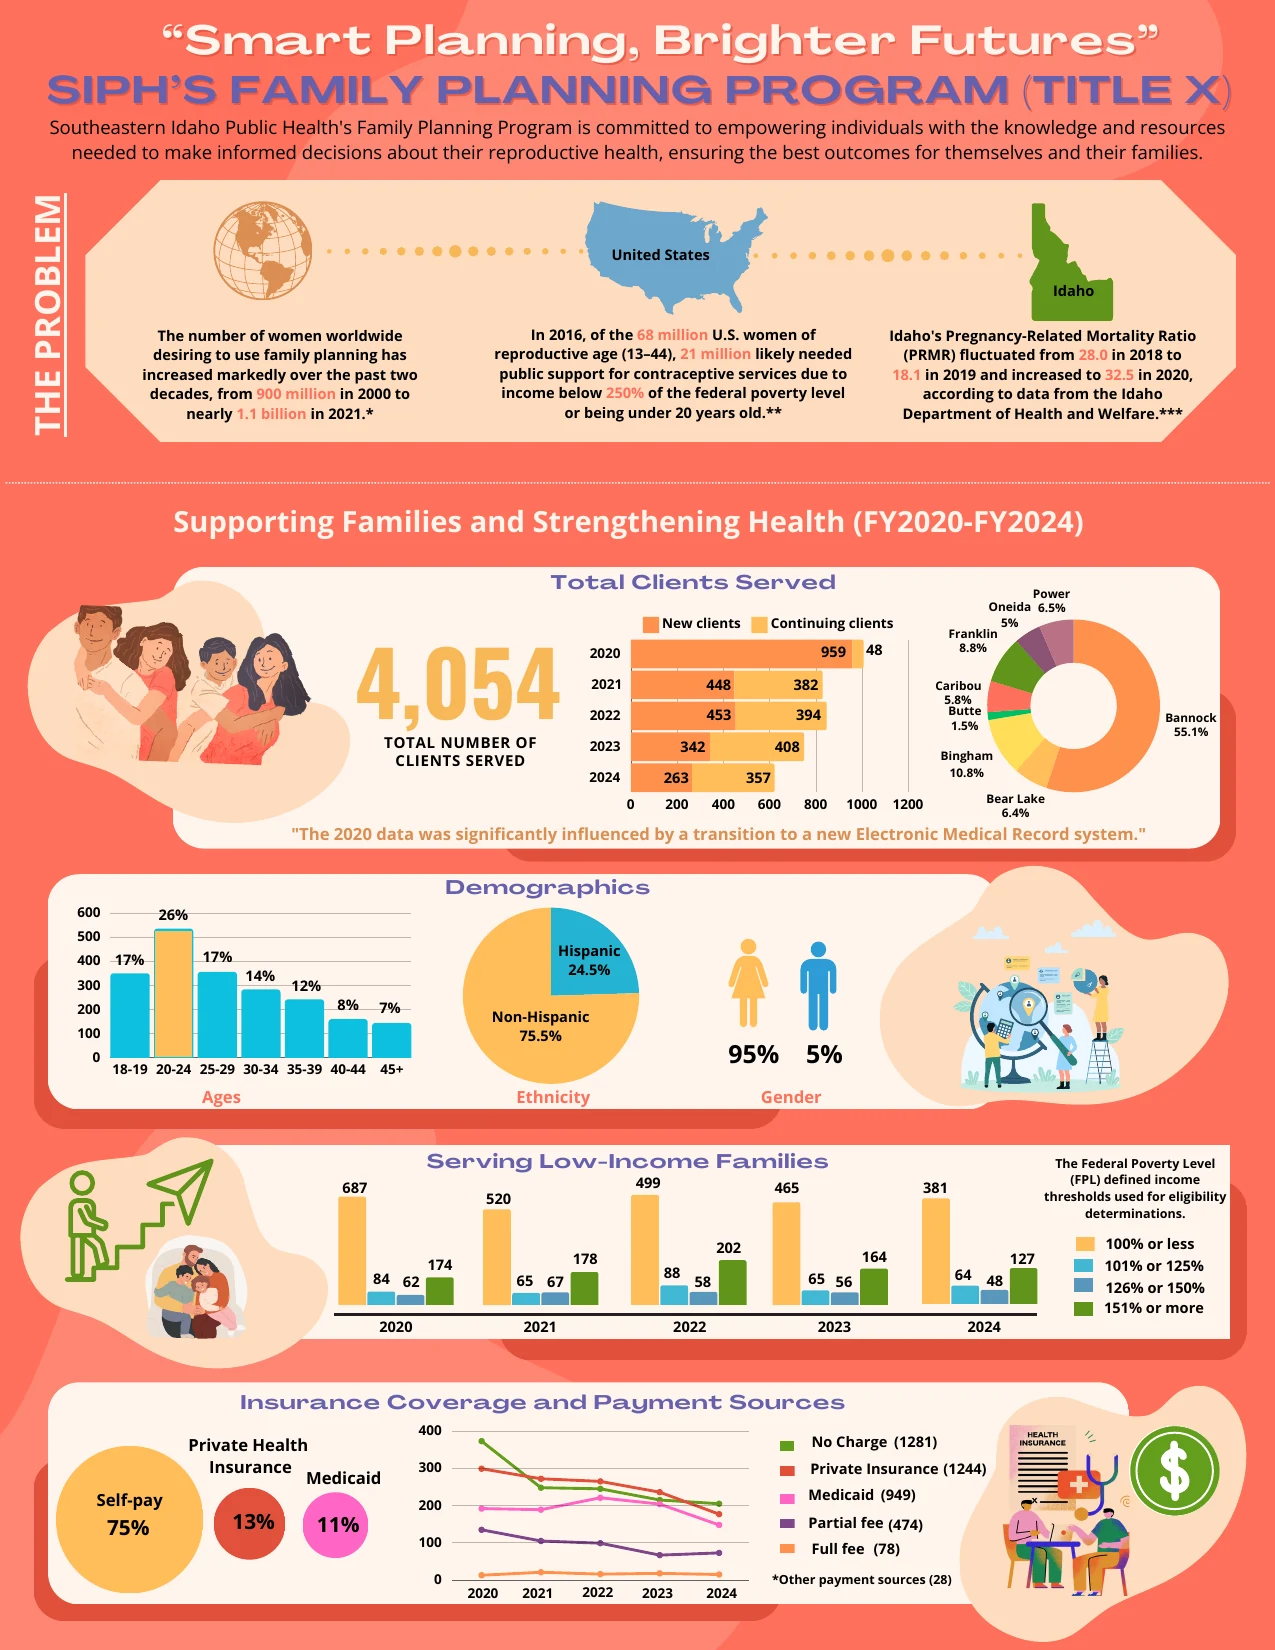
Selected measures from FY2020 through FY2024.
Clients Served
Total clients served during the five-year review.
Birth Control Access
Birth control services recorded from FY2022 through FY2024.
Interpreter Services
Clients provided with an interpreter.
Self-Pay
Share of payment sources categorized as self-pay.
Open each section for accessible tables and supporting details.
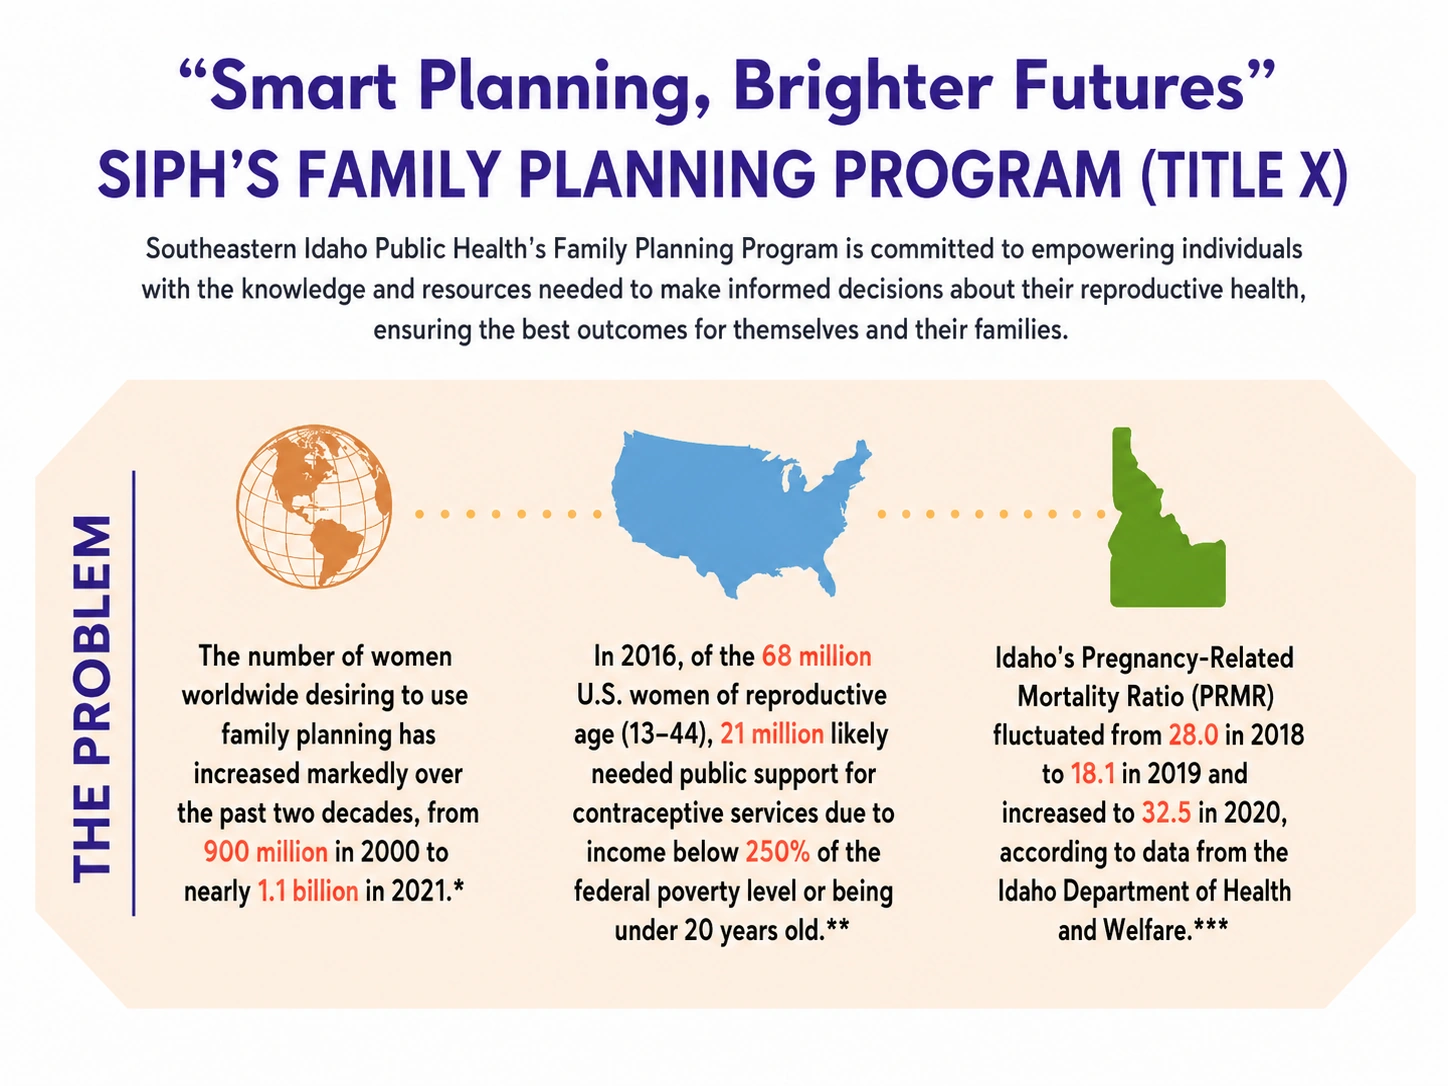
The report highlights growing demand for family planning services, the need for publicly supported contraceptive care, and Idaho pregnancy-related mortality trends.
| Measure | Reported Value |
|---|---|
| Women worldwide desiring family planning, 2000 | 900 million |
| Women worldwide desiring family planning, 2021 | Nearly 1.1 billion |
| U.S. women likely needing public contraceptive support in 2016 | 21 million |
| Idaho pregnancy-related mortality ratio, 2018 | 28.0 |
| Idaho pregnancy-related mortality ratio, 2019 | 18.1 |
| Idaho pregnancy-related mortality ratio, 2020 | 32.5 |
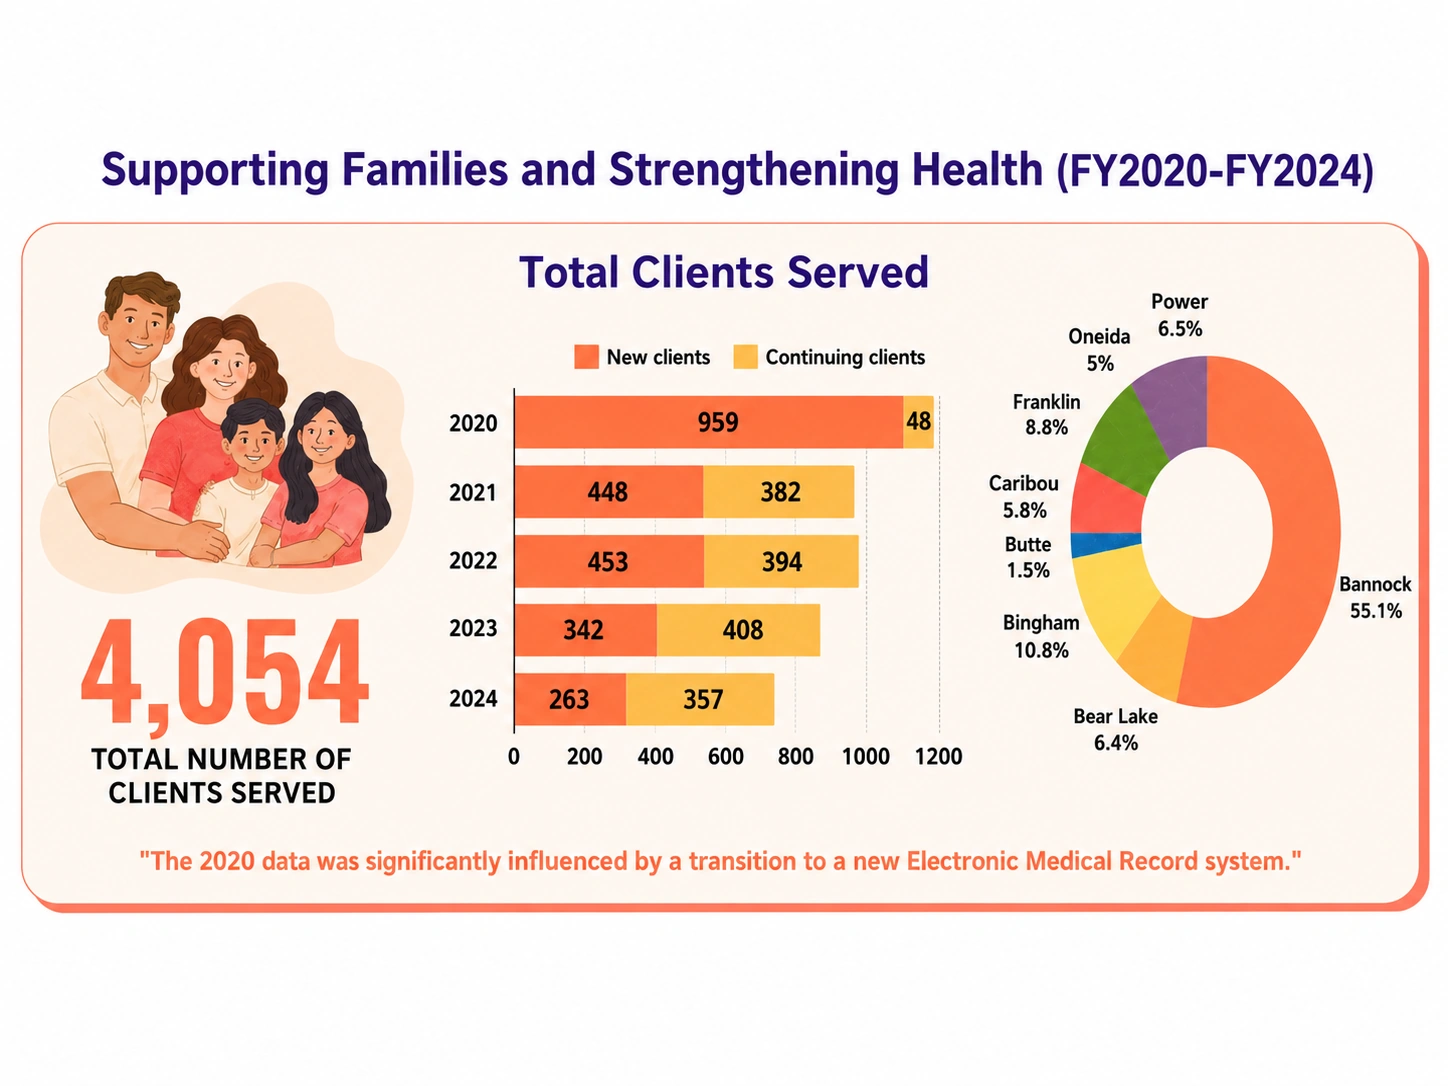
The program served 4,054 clients from FY2020 through FY2024, including both new and continuing clients across the district.
| Year | New Clients | Continuing Clients |
|---|---|---|
| 2020 | 959 | 48 |
| 2021 | 448 | 382 |
| 2022 | 453 | 394 |
| 2023 | 342 | 408 |
| 2024 | 263 | 357 |
| Total | 4,054 | |
| County | Share |
|---|---|
| Bannock | 55.1% |
| Bingham | 10.8% |
| Franklin | 8.8% |
| Power | 6.5% |
| Bear Lake | 6.4% |
| Caribou | 5.8% |
| Oneida | 5% |
| Butte | 1.5% |
The source notes that 2020 data was significantly affected by a transition to a new electronic medical record system.
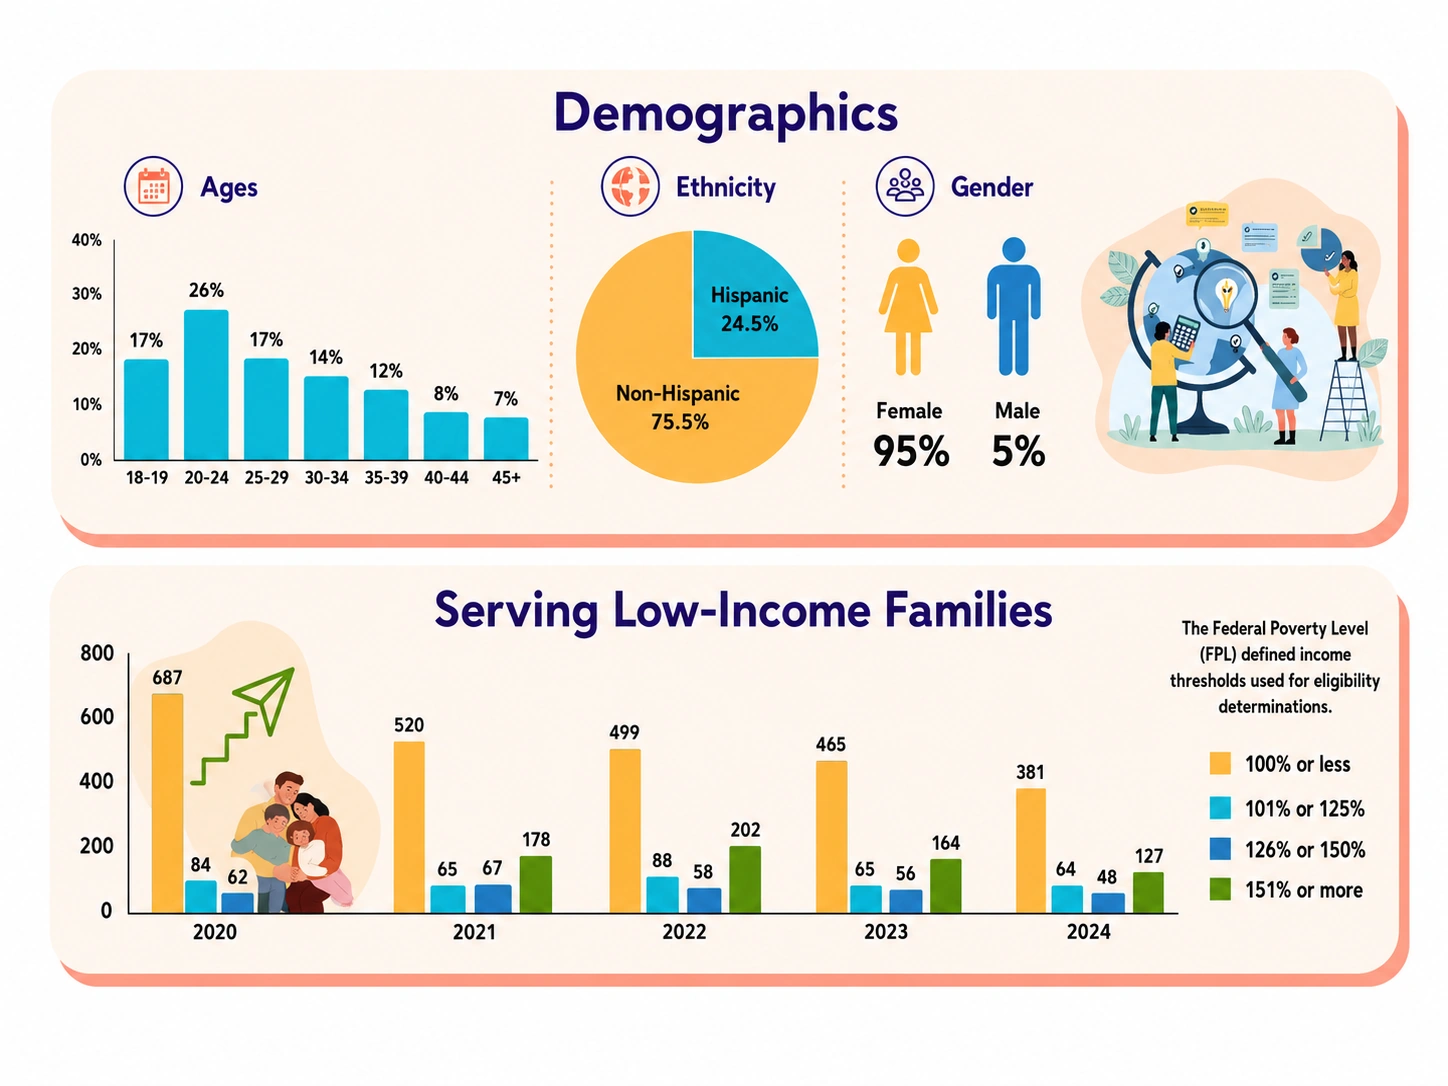
Clients represented a broad age range, with the largest group ages 20-24. Most clients were non-Hispanic and female, and many were at or below the federal poverty level.
| Measure | Value |
|---|---|
| Age 18-19 | 17% |
| Age 20-24 | 26% |
| Age 25-29 | 17% |
| Age 30-34 | 14% |
| Age 35-39 | 12% |
| Age 40-44 | 8% |
| Age 45 and older | 7% |
| Hispanic | 24.5% |
| Non-Hispanic | 75.5% |
| Female | 95% |
| Male | 5% |
The report also tracks clients by federal poverty level category: 100% or less, 101%-125%, 126%-150%, and 151% or more.
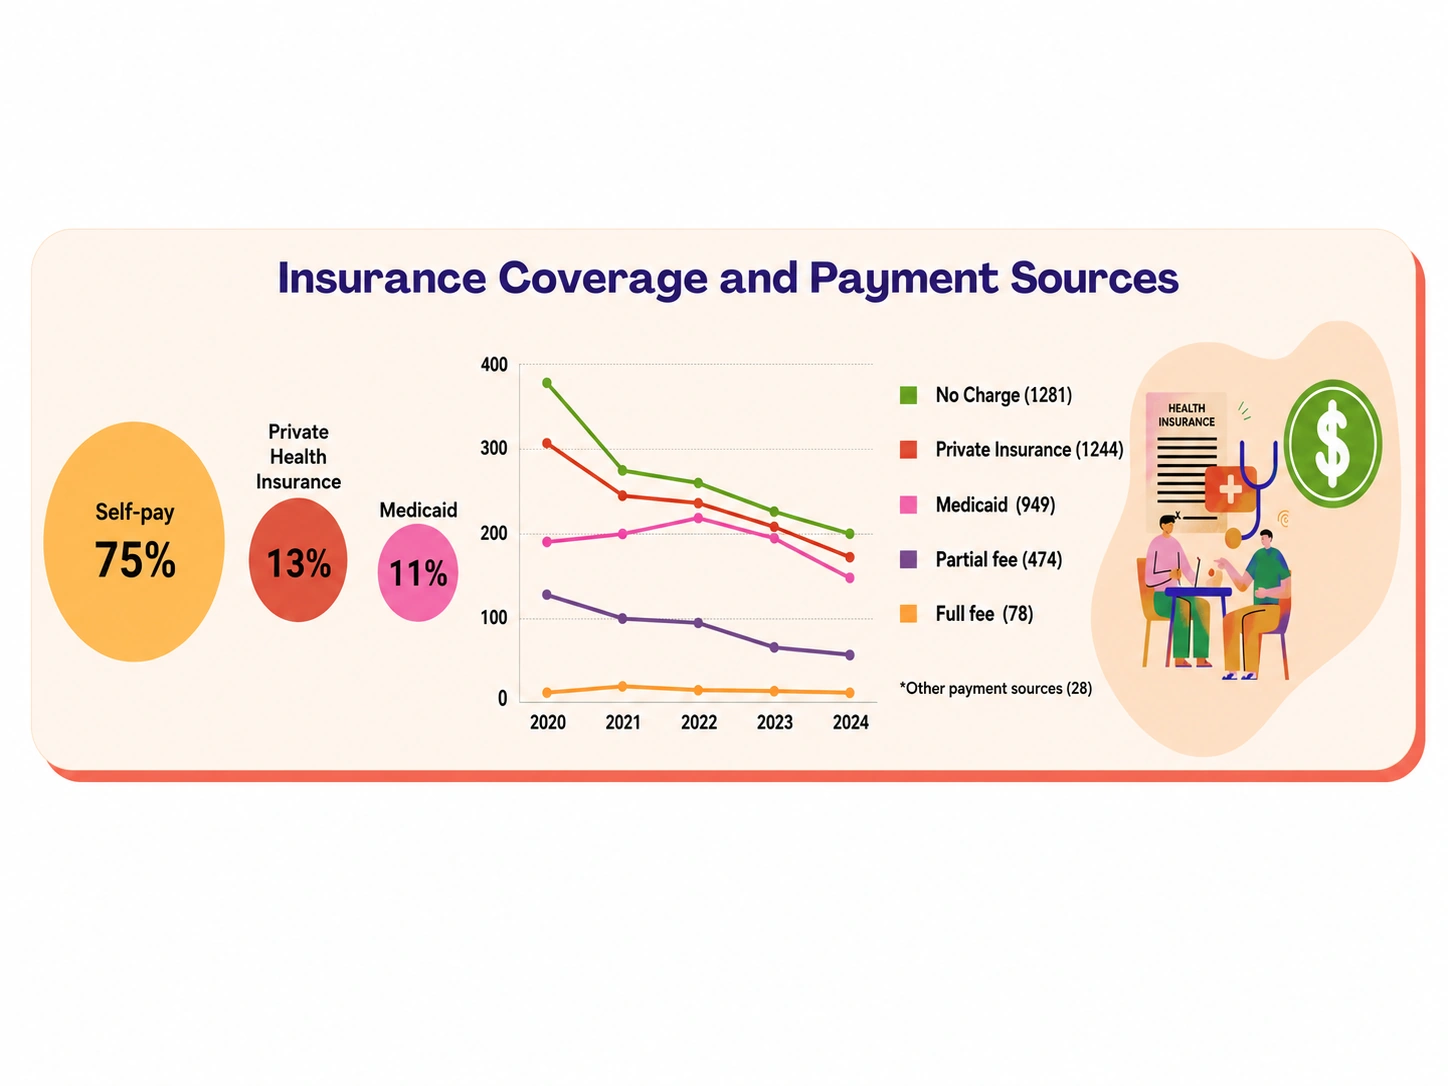
Self-pay accounted for the largest share of payment sources, followed by private health insurance and Medicaid.
| Payment Source | Share or Count |
|---|---|
| Self-pay | 75% |
| Private health insurance | 13% |
| Medicaid | 11% |
| No charge | 1,281 |
| Private insurance | 1,244 |
| Medicaid | 949 |
| Partial fee | 474 |
| Full fee | 78 |
| Other payment sources | 28 |
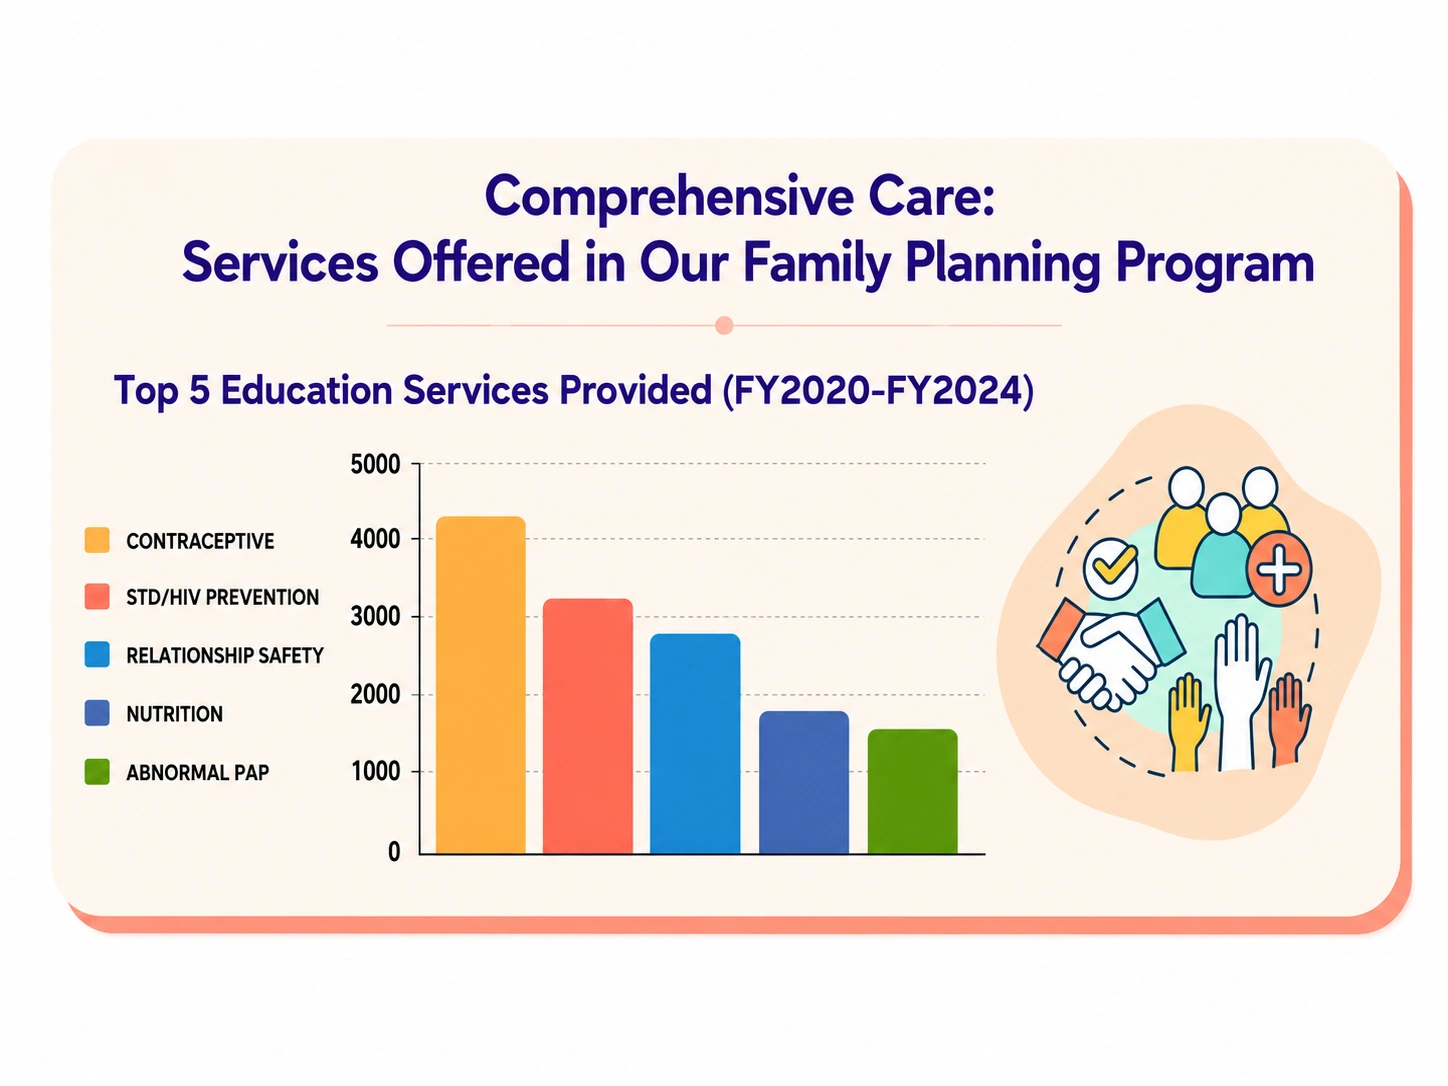
The program provided education about contraception, STI and HIV prevention, relationship safety, nutrition, and abnormal Pap results.
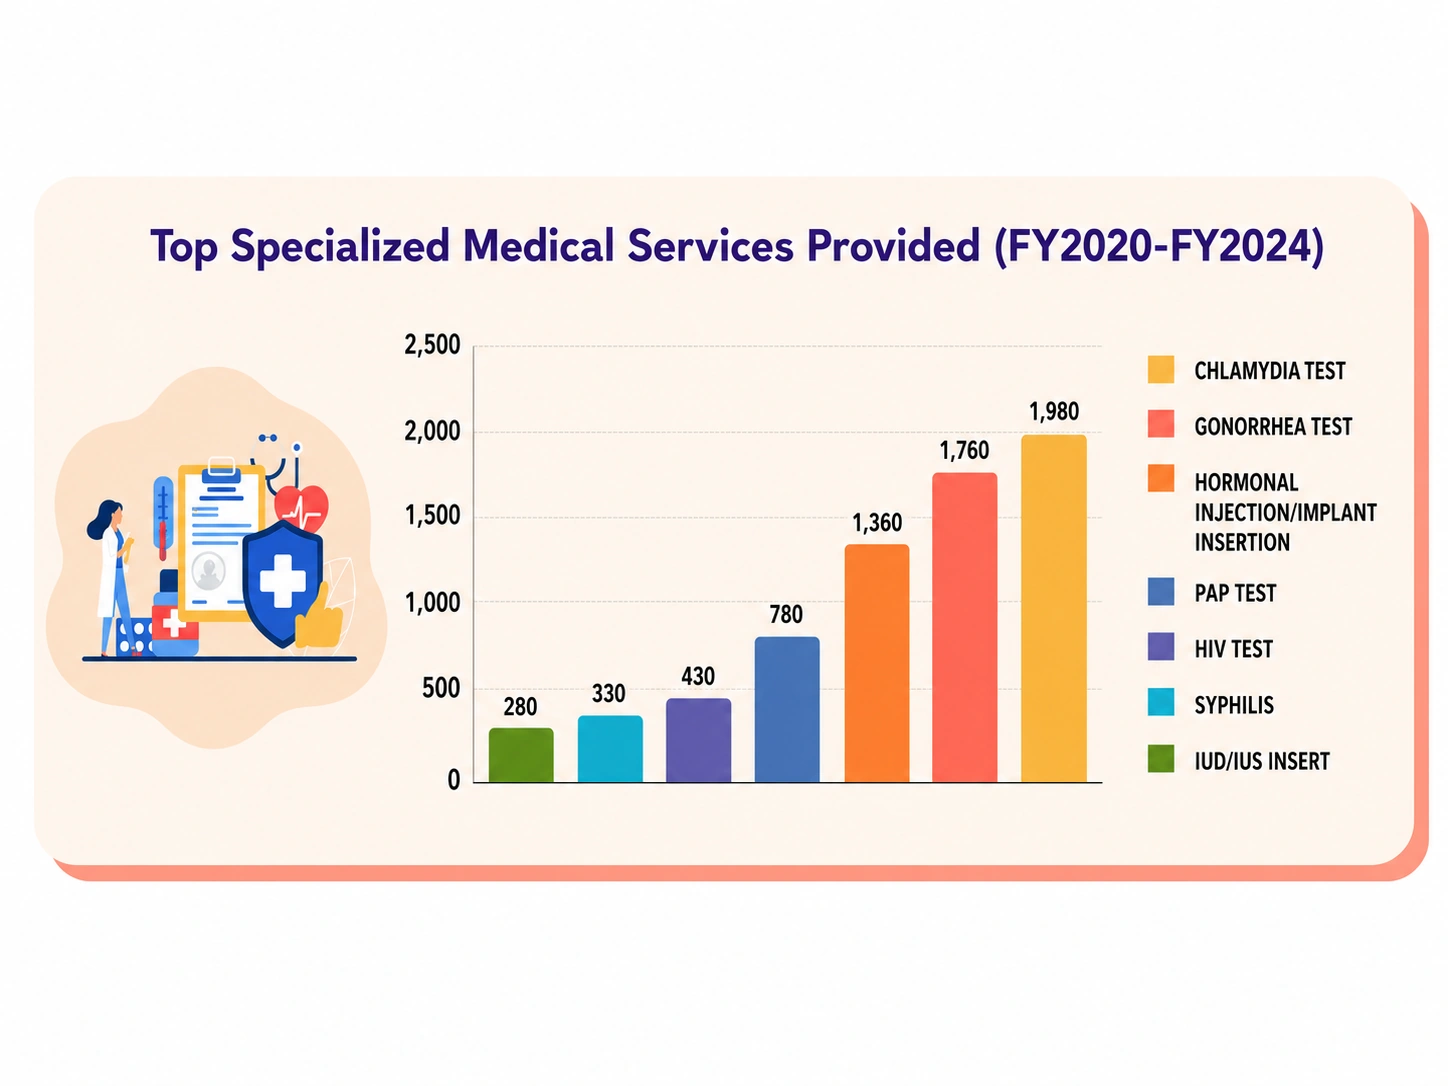
Services included STI testing, Pap testing, HIV and syphilis testing, hormonal contraception, and IUD or IUS insertion.
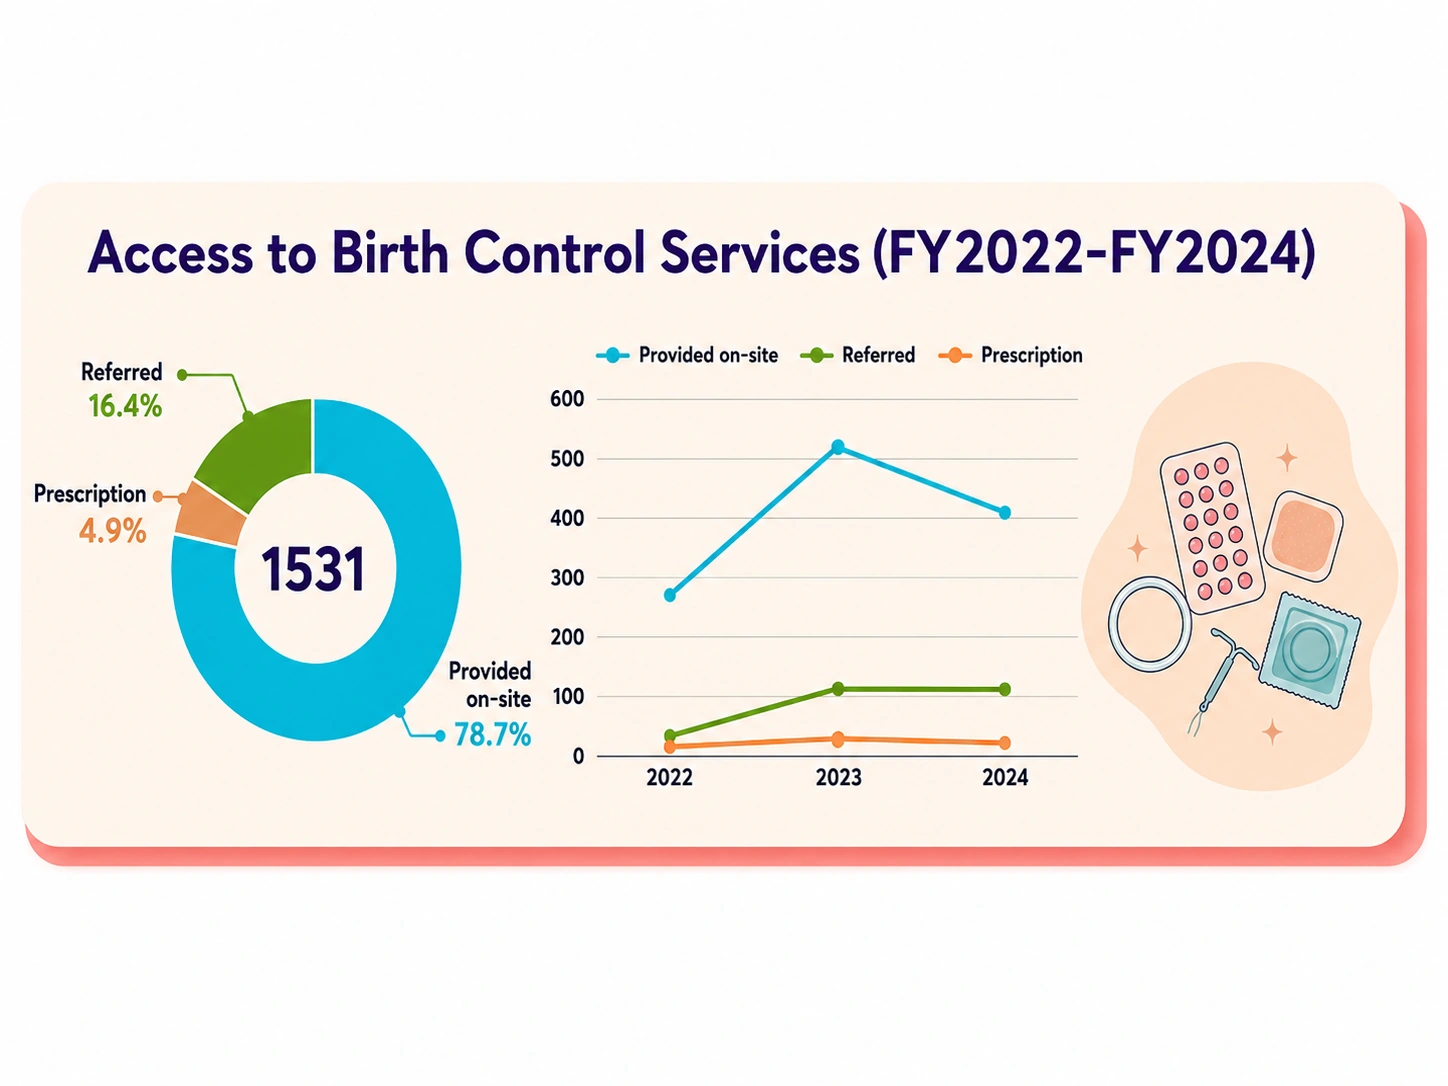
From FY2022 through FY2024, 1,531 birth control services were recorded. Most were provided on-site.
| Delivery Method | Share |
|---|---|
| Provided on-site | 78.7% |
| Referred | 16.4% |
| Prescription | 4.9% |
| Total services | 1,531 |
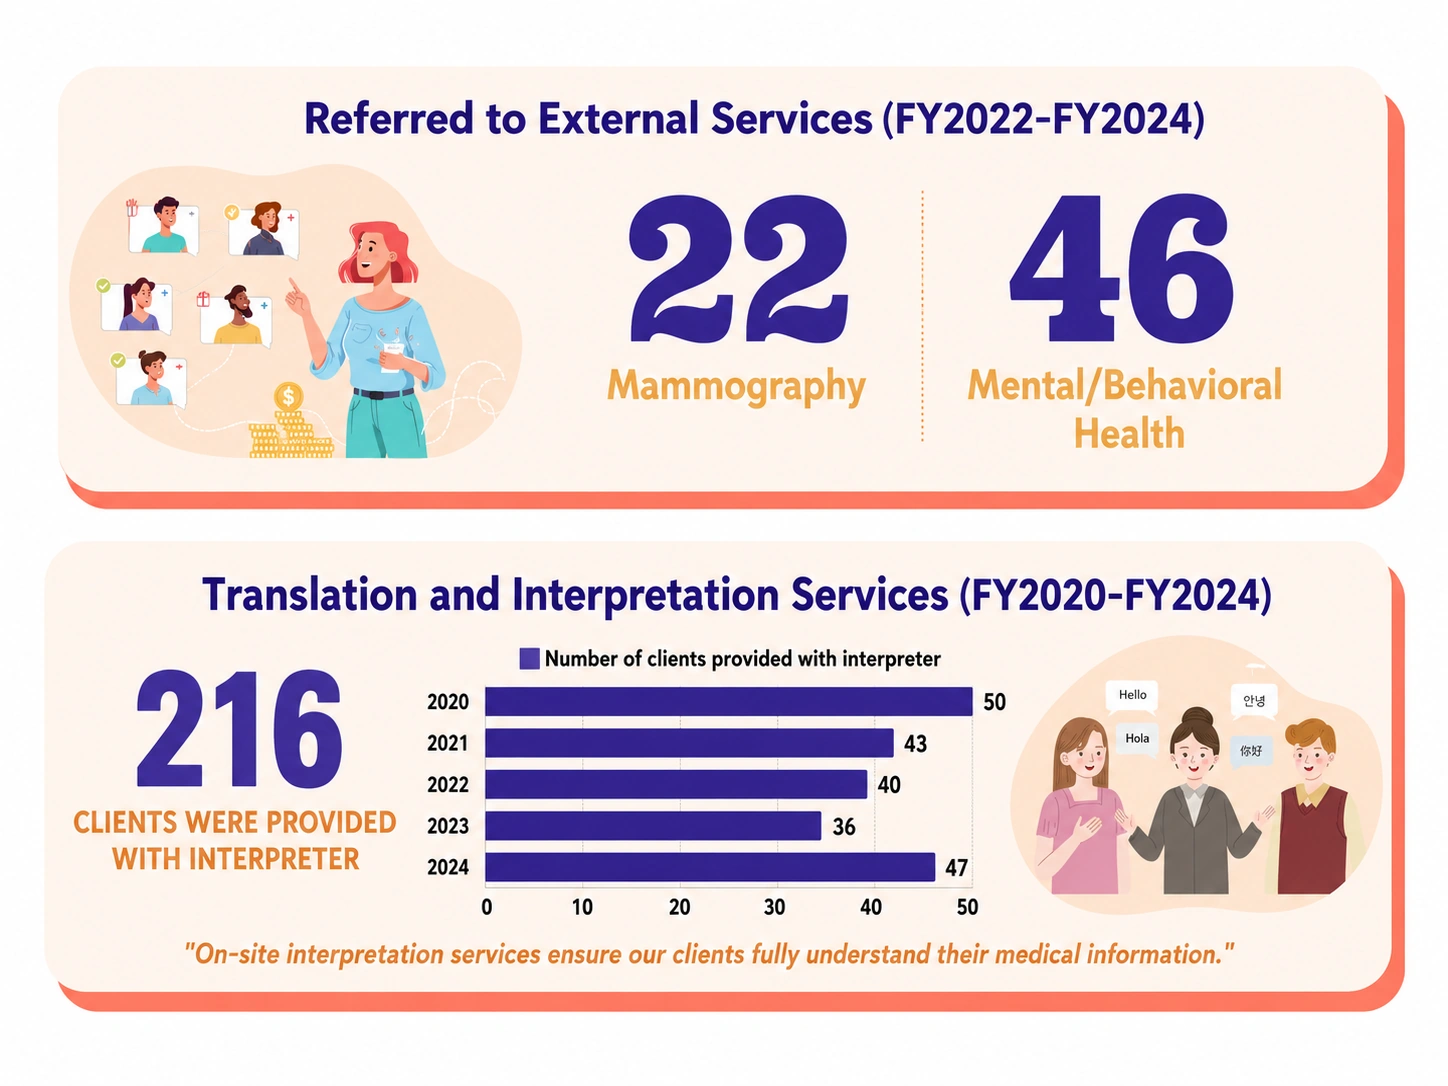
The program connected clients with mammography and mental or behavioral health services and provided interpretation support so clients could understand medical information.
| Service | Count |
|---|---|
| Mammography referrals | 22 |
| Mental or behavioral health referrals | 46 |
| Clients provided with an interpreter | 216 |
Select an image to open a larger version, or view the original PDF.
Program need, clients served, demographics, income, insurance, and payment sources.
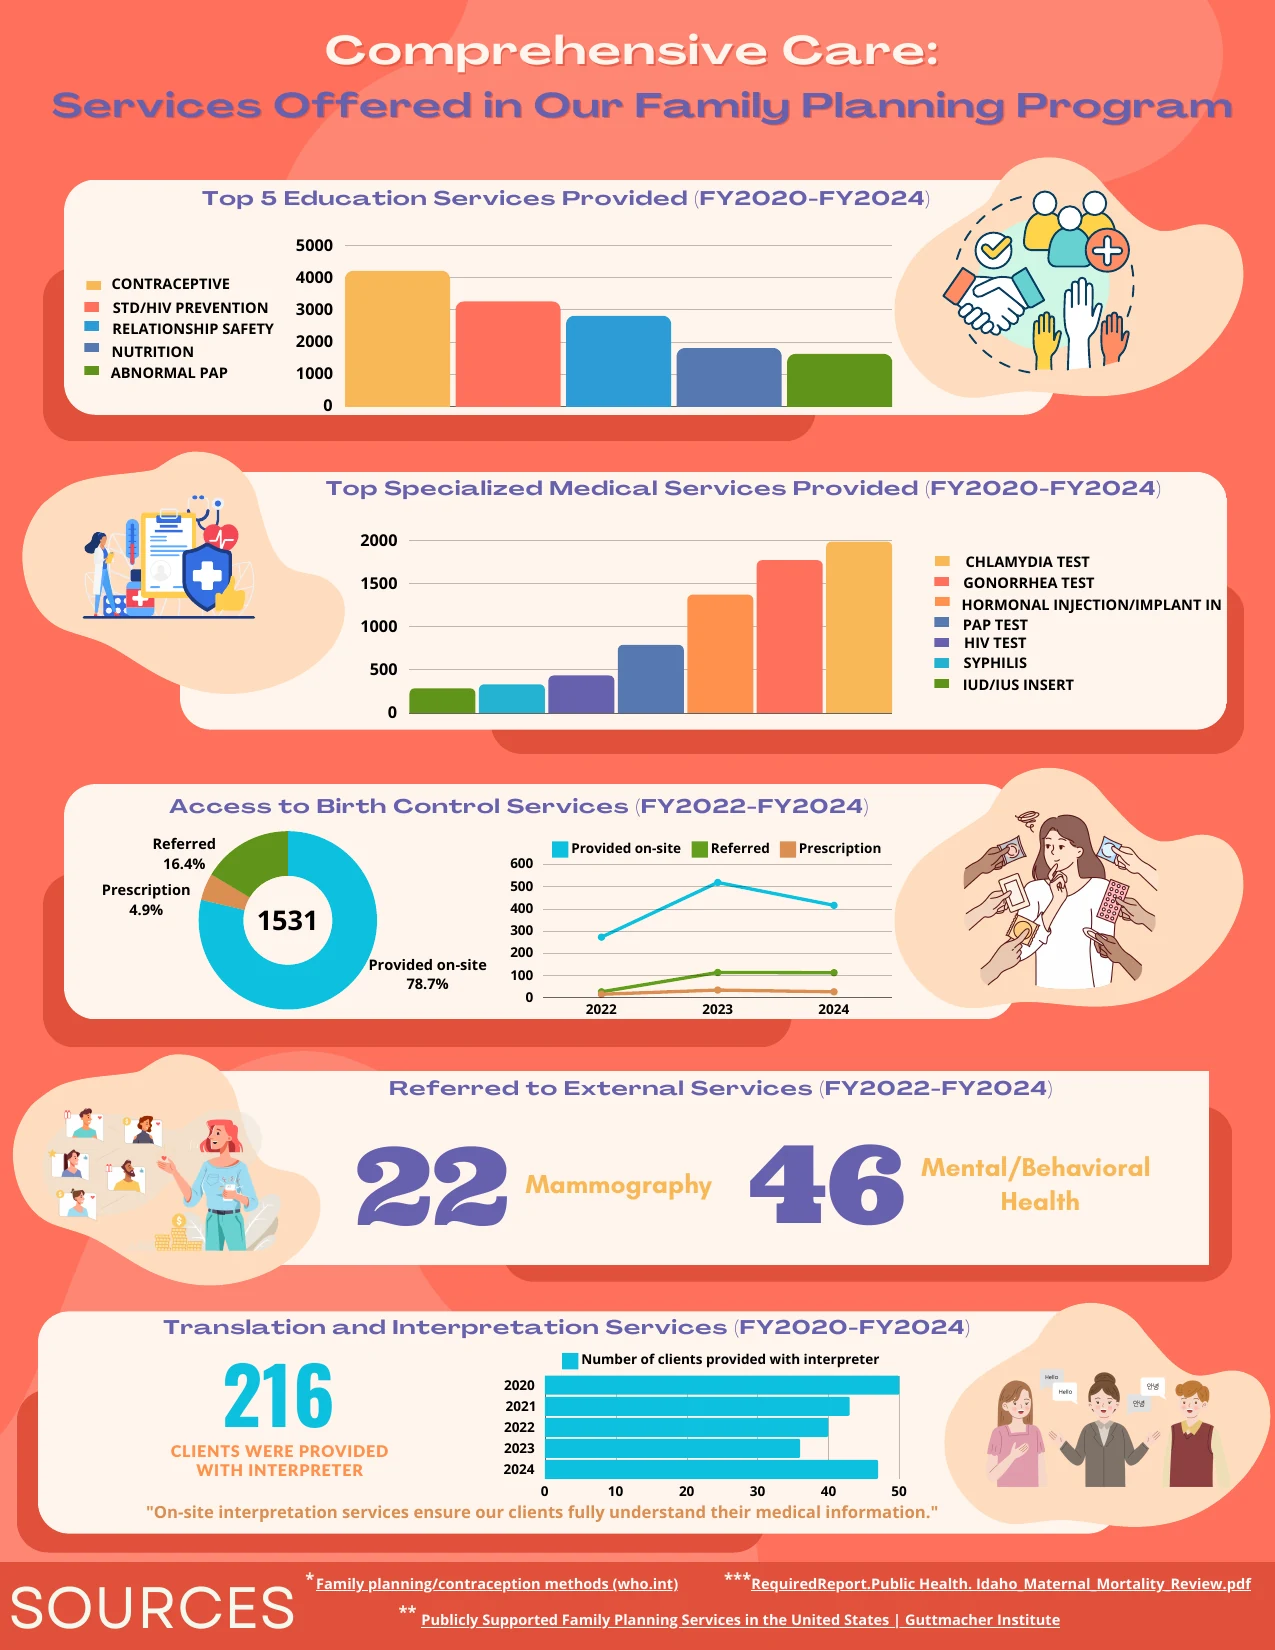
Education, testing, birth control access, referrals, and interpretation services.