FY2024 Class Visits
1,287
Total participant visits reported in FY2024.

Community Health / Healthy Aging
Southeastern Idaho Public Health's Fit & Fall Proof Program helps older adults remain active, independent, and safe by reducing fall risk through community exercise classes, education, and local partnerships.
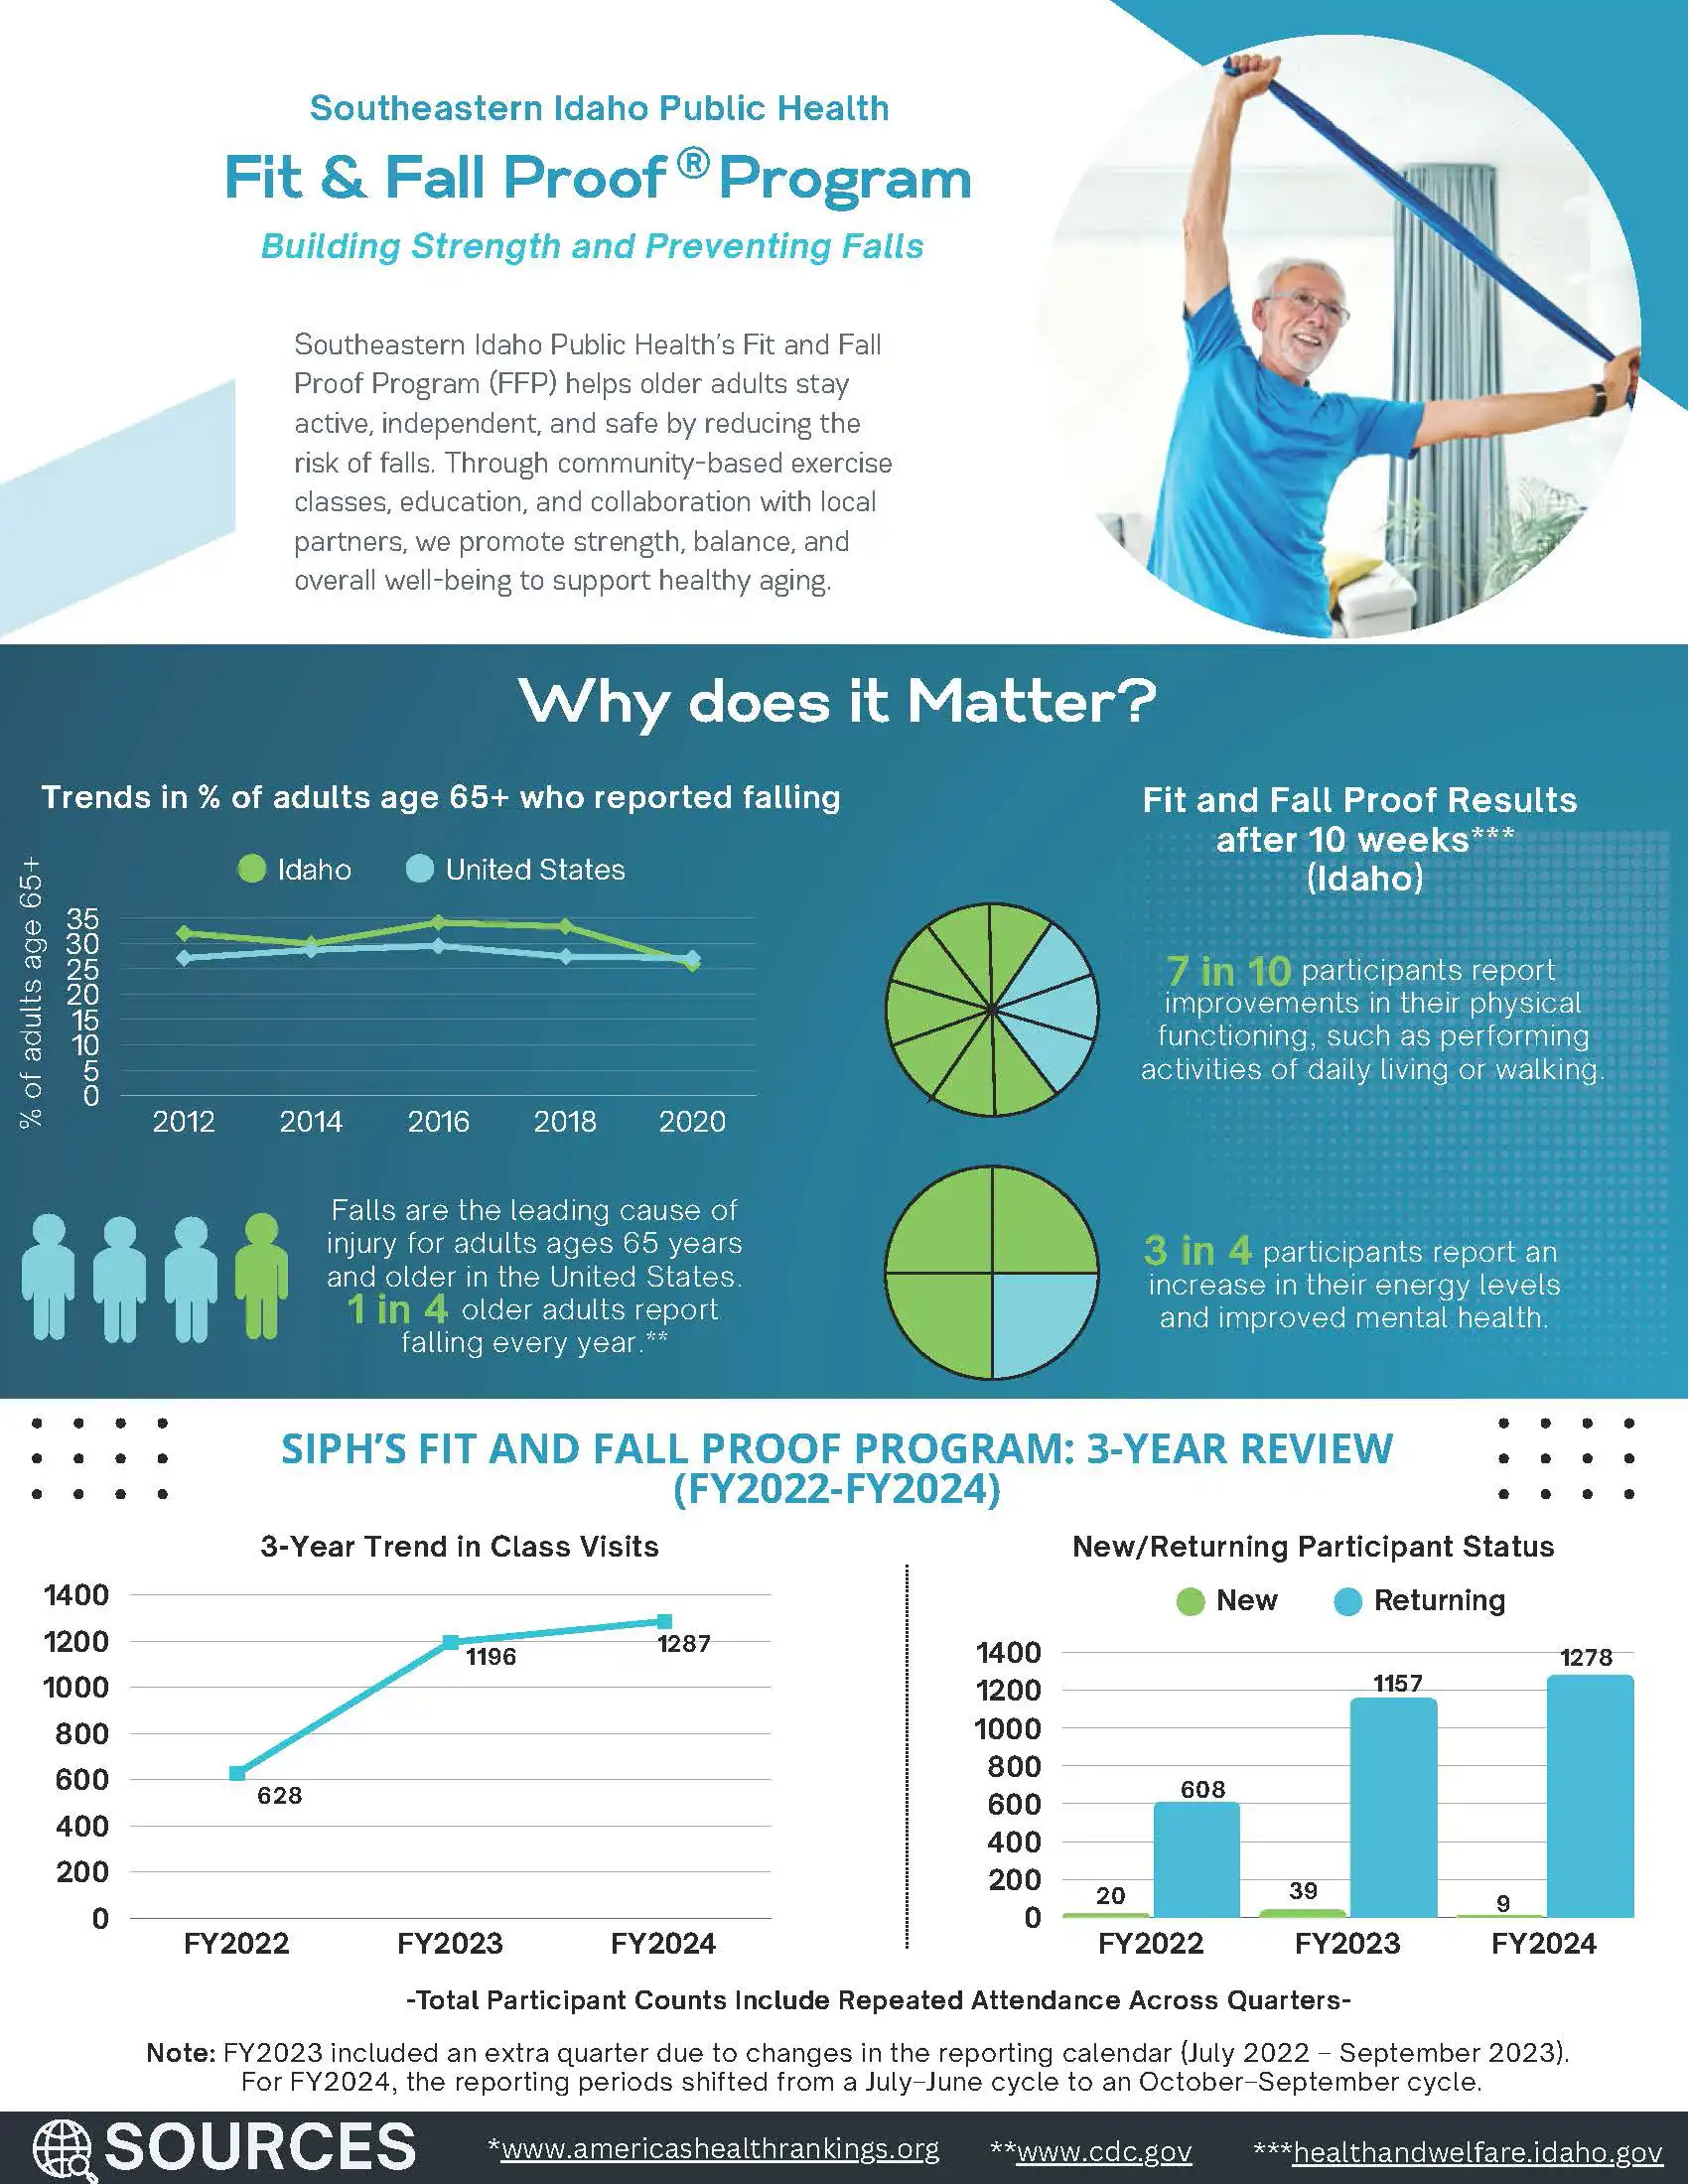
Selected results from FY2022 through FY2024.
FY2024 Class Visits
Total participant visits reported in FY2024.
Class Sites
Class sites across six counties.
Survey Participants
Participants included in the post-pandemic survey analysis.
Community Connection
Survey respondents who felt more connected to their community through FFP.
Open each section for accessible tables and supporting details.
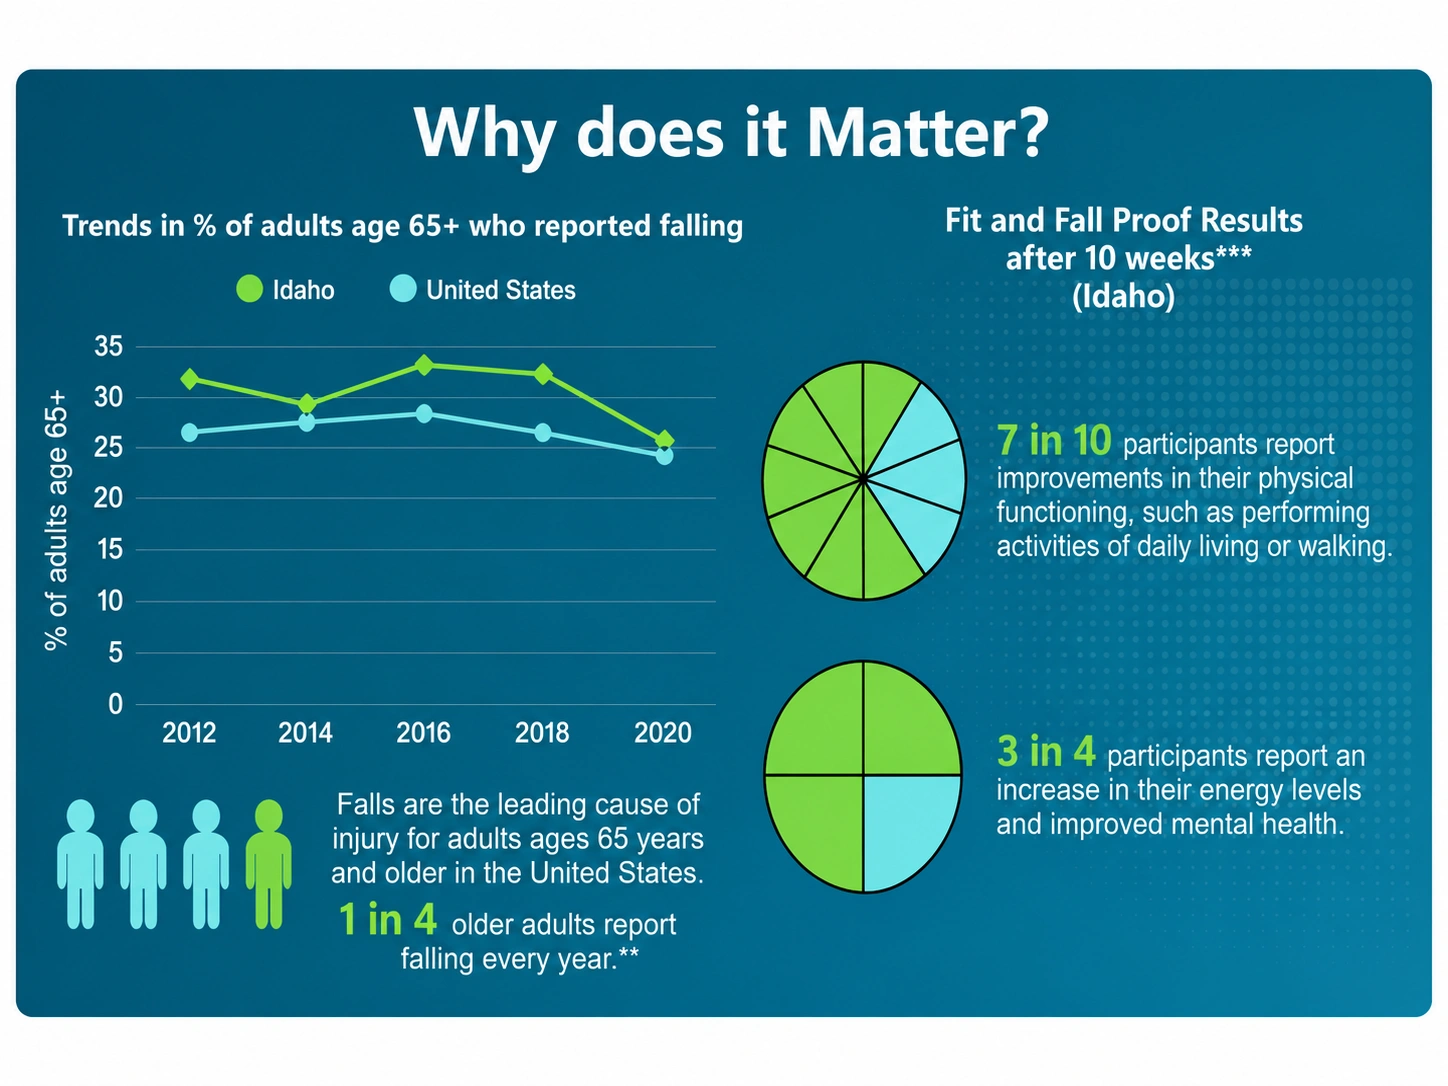
Falls are a leading cause of injury among adults age 65 and older. The report highlights improvements in physical functioning, energy, and mental health among participants.
| Measure | Reported Result |
|---|---|
| Older adults who report falling each year | 1 in 4 |
| Participants reporting improved physical functioning after 10 weeks | 7 in 10 |
| Participants reporting increased energy and improved mental health | 3 in 4 |
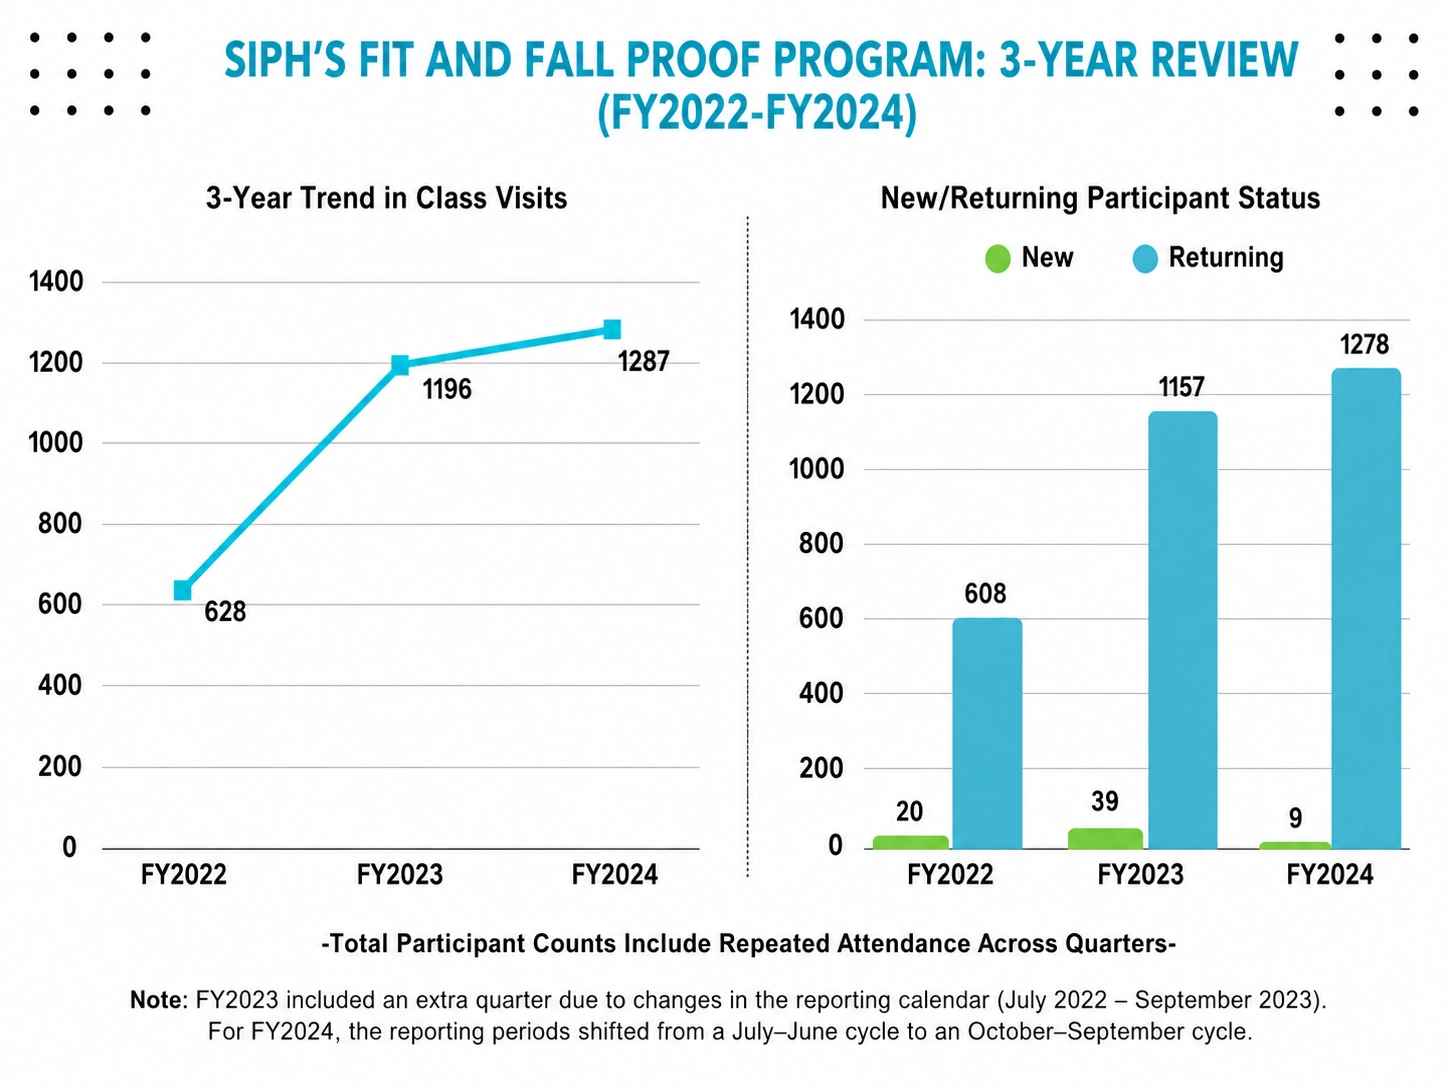
Class visits increased from 628 in FY2022 to 1,287 in FY2024. Most visits were made by returning participants.
| Fiscal Year | New | Returning | Total Visits |
|---|---|---|---|
| FY2022 | 20 | 608 | 628 |
| FY2023 | 39 | 1,157 | 1,196 |
| FY2024 | 9 | 1,278 | 1,287 |
Totals include repeated attendance across quarters. FY2023 included an extra quarter because of reporting-calendar changes, and FY2024 shifted to an October-September cycle.
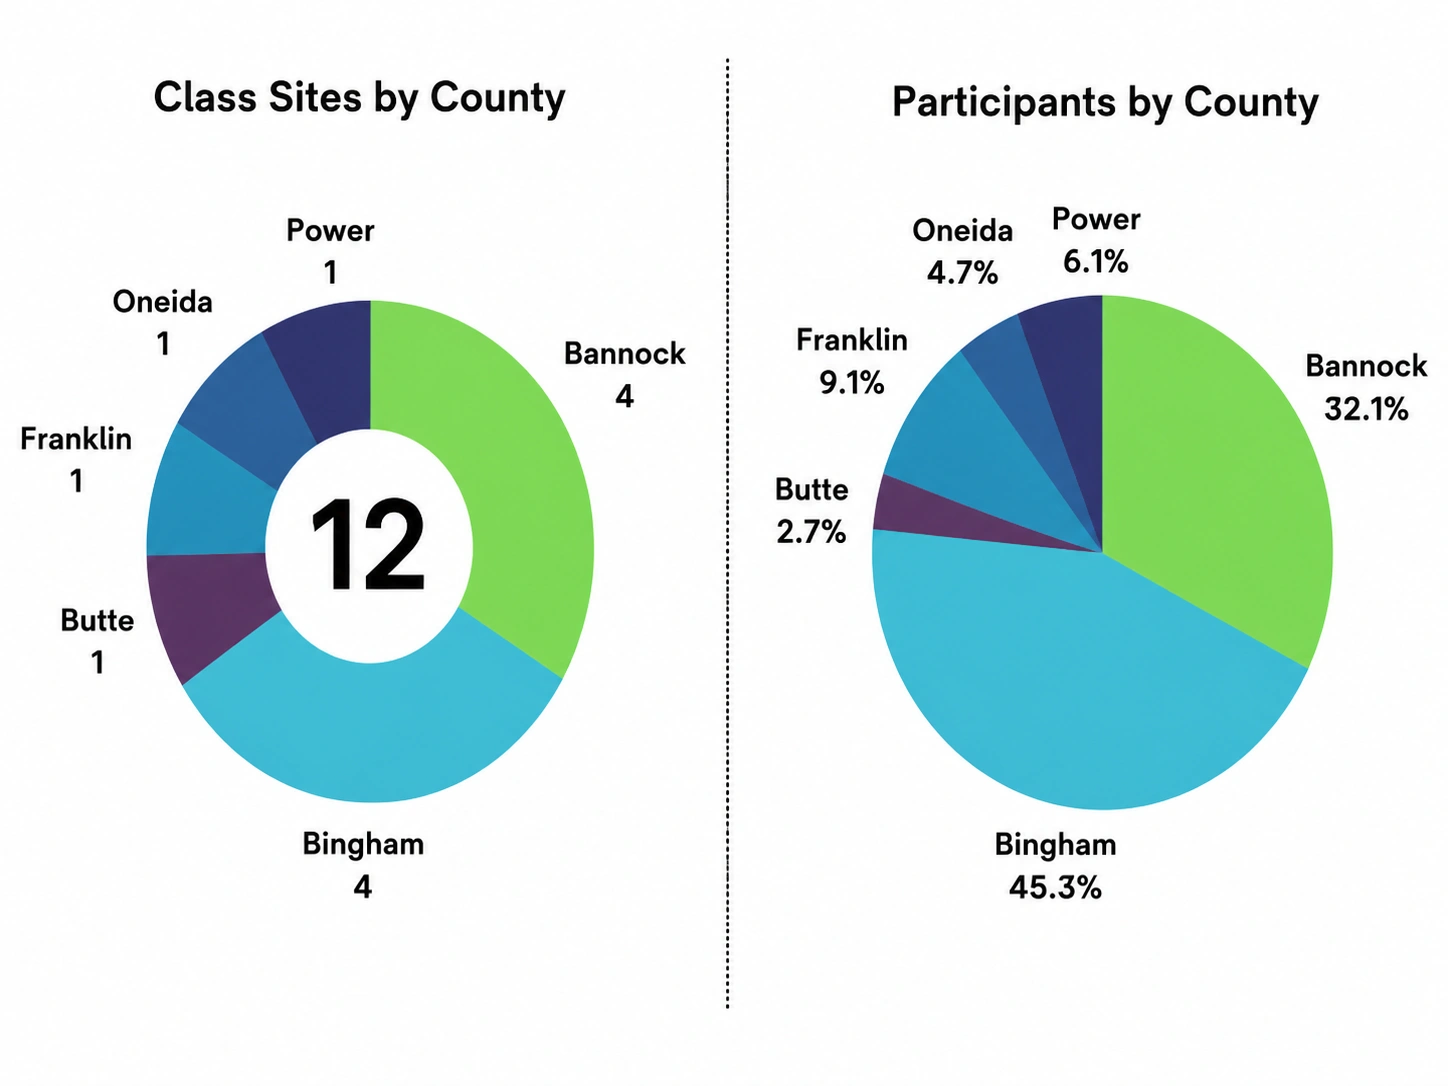
The program operated 12 class sites across six counties. Bingham County accounted for the largest share of participants.
| County | Class Sites |
|---|---|
| Bannock | 4 |
| Bingham | 4 |
| Butte | 1 |
| Franklin | 1 |
| Oneida | 1 |
| Power | 1 |
| Total | 12 |
| County | Share |
|---|---|
| Bingham | 45.3% |
| Bannock | 32.1% |
| Franklin | 9.1% |
| Power | 6.1% |
| Oneida | 4.7% |
| Butte | 2.7% |
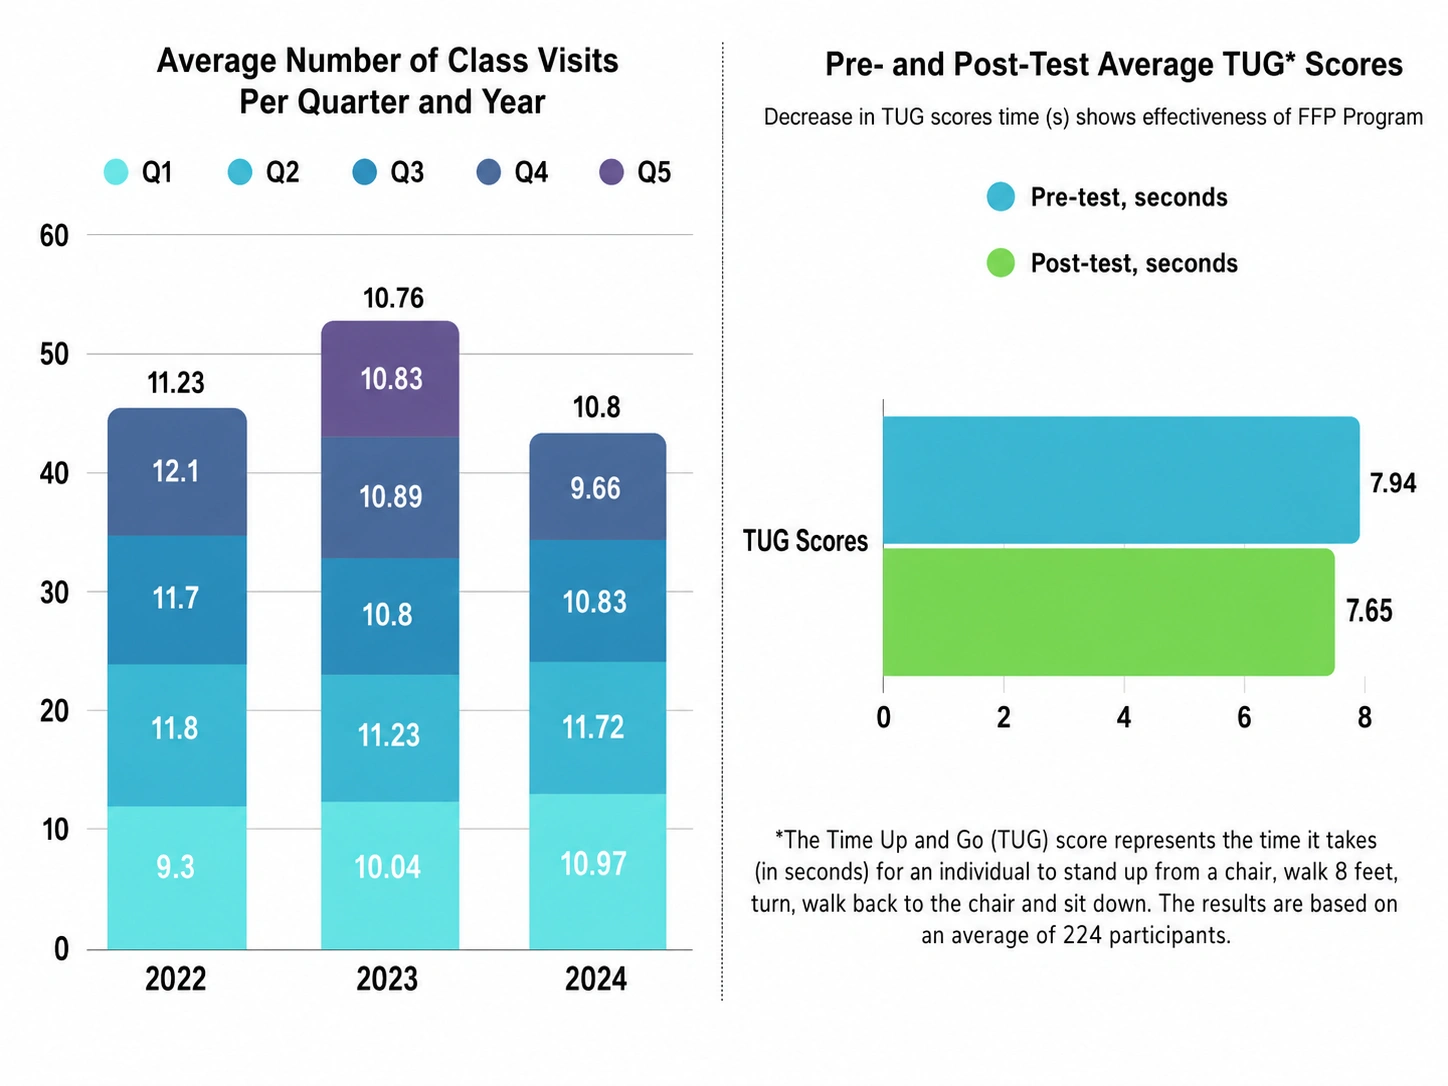
Timed Up and Go scores improved from an average of 7.94 seconds before testing to 7.65 seconds after participation. Lower times indicate improved mobility.
| Assessment | Average Seconds |
|---|---|
| Pre-test | 7.94 |
| Post-test | 7.65 |
The Timed Up and Go assessment measures how long it takes a participant to stand, walk eight feet, turn, return, and sit. The report states that results were based on an average of 224 participants.
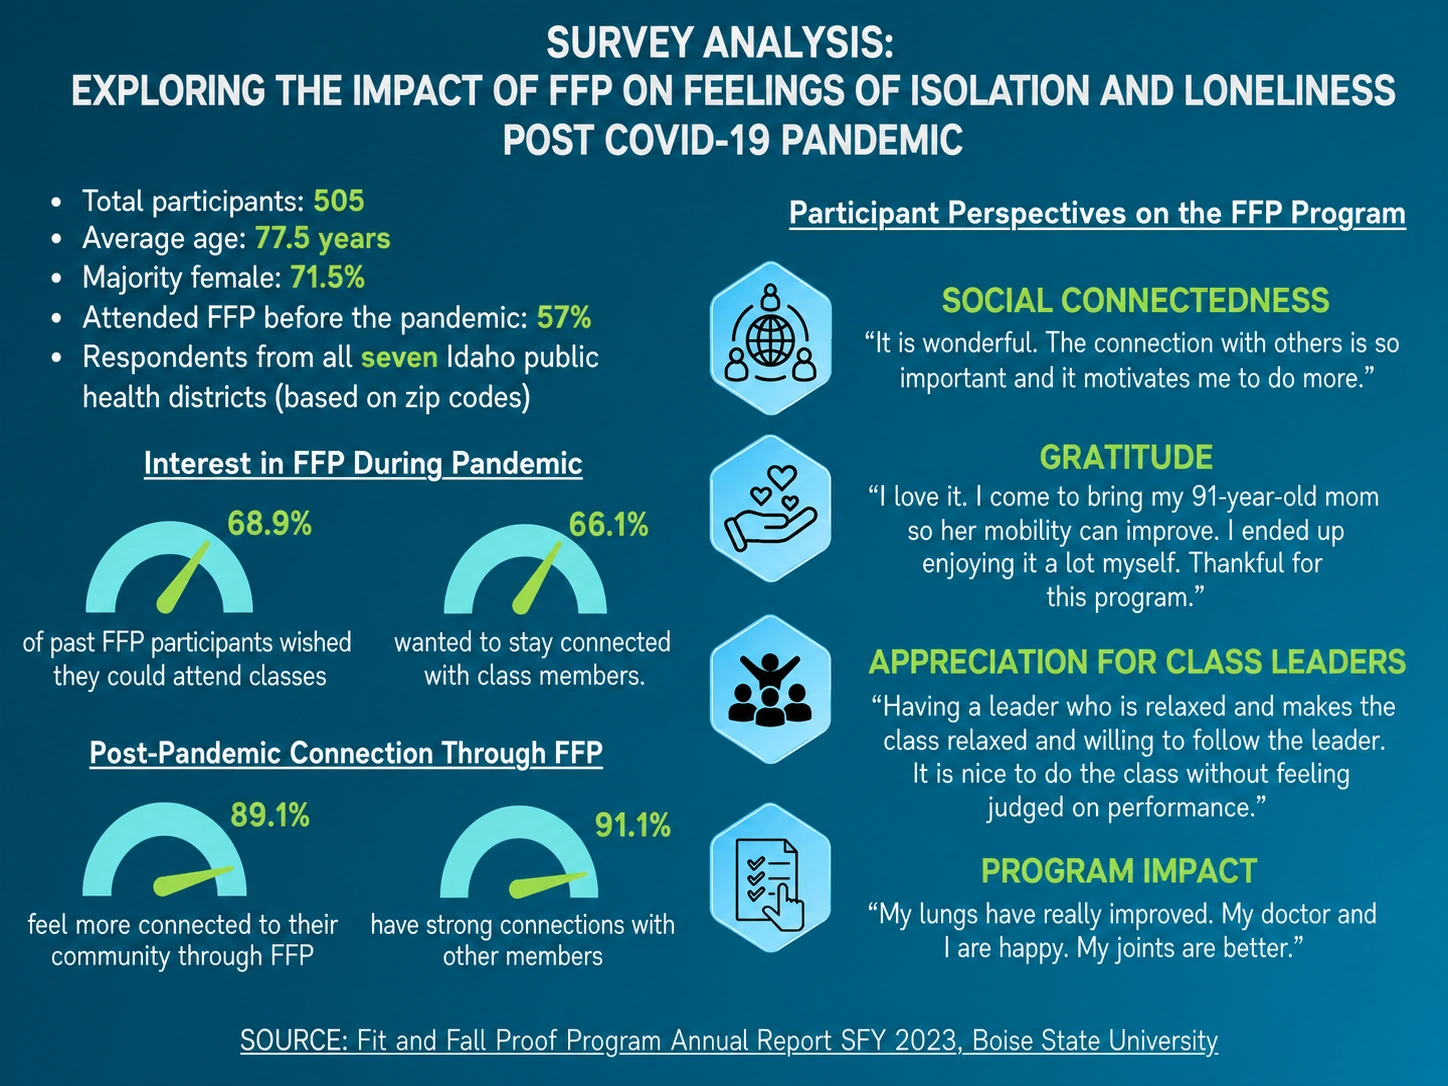
Survey results show strong community connection and interest in maintaining relationships with class members.
| Measure | Result |
|---|---|
| Survey participants | 505 |
| Average age | 77.5 years |
| Female participants | 71.5% |
| Attended FFP before the pandemic | 57% |
| Wished they could attend classes during the pandemic | 68.9% |
| Wanted to stay connected with class members | 66.1% |
| Felt more connected to their community through FFP | 89.1% |
| Reported strong connections with other members | 91.1% |
Select an image to open a larger version, or view the original PDF.
Program overview, fall risk, participant outcomes, and three-year class-visit trends.
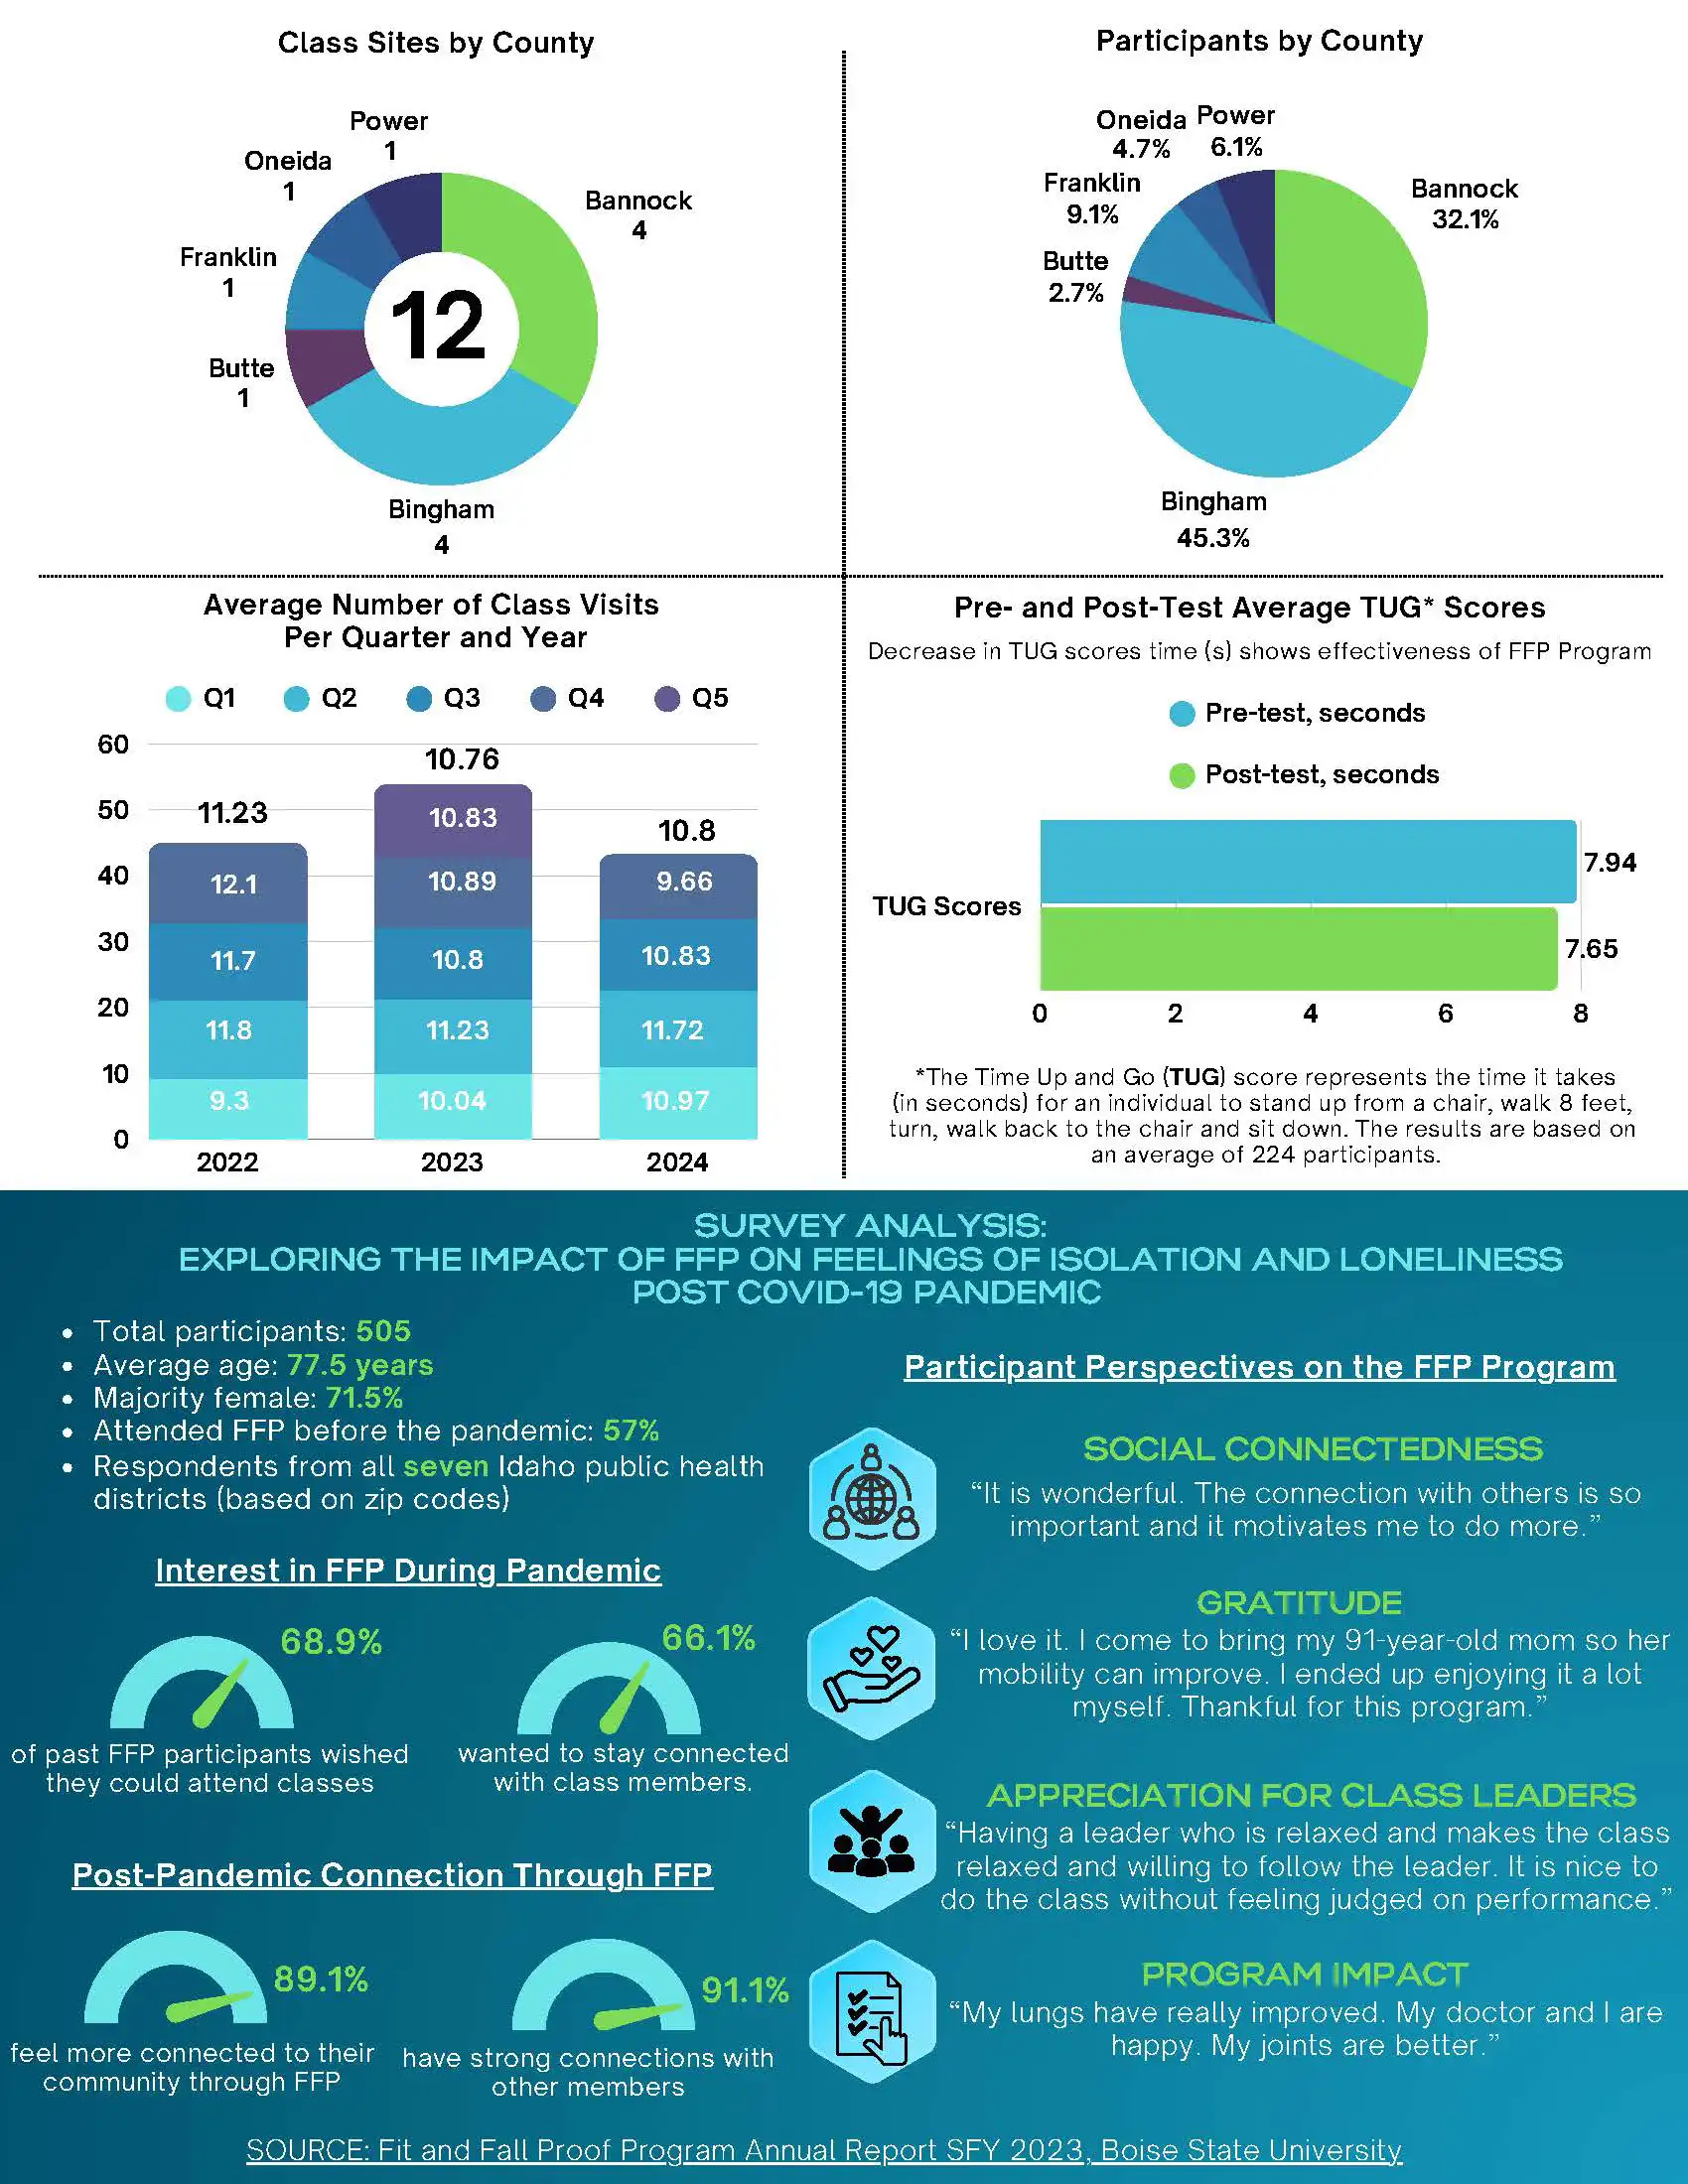
Class sites, county participation, mobility testing, and participant survey findings.